Introduction
In today’s DevOps world, Continuous Integration (CI) is a key part of keeping everything running smoothly. It helps teams deliver code faster and catch issues early. But how do we actually measure how well our CI pipelines are working? That’s where metrics come in.
A lot of teams rely on DORA Metrics—an industry-standard for tracking software delivery performance, focusing on metrics like deployment frequency and failure recovery. These practices have been around for years, and many DevOps SaaS tools emphasize the CD (Continuous Delivery) side by monitoring DORA metrics.
At CICube, we’ve taken this concept further with CubeScore™️ North Star Metrics, a system designed to specifically measure and optimize CI (Continuous Integration) performance. While DORA Metrics provide a broad overview of software delivery, CubeScore™️'s North Star metrics focuses on the unique challenges of CI, helping teams fine-tune their pipelines and monitor their progress toward sector median and elite benchmarks.
We believe the CI process needs monitoring and optimization. That’s why we built CICube, focusing on the CI part—just like DORA metrics do for CD, it analyzes the metrics needed to track the performance of the CI process and helps teams monitor how close they are to elite status.
Let’s take a closer look at what CI North Star metrics are and how it compares to the DORA Metrics.
Step by step, we will cover:
- What Are DORA Metrics?
- CubeScore™️: CI-Focused DORA Metrics Performance Analyzer
- Why CubeScore™️ Steps In?
What Are DORA Metrics?
The benefits of DORA metrics for your organization are pretty straightforward: they offer a data-driven method to measure and improve your software delivery process.
I won’t go into too much detail since there are plenty of resources out there. However, let me briefly cover the four most important DORA metrics that help DevOps teams track and improve their performance:
Deployment Frequency
This metric tells you how often your team successfully releases software to production, making it a good indicator of how quickly your team can deliver features or fixes.
How it’s calculated: Deployment frequency is measured by the average number of successful deployments to production over a given time period.
Lead Time for Changes
This metric focuses on speed. It tracks how long it takes for a code change—from commit to deployment—to reach production. Shorter lead times indicate your team’s ability to rapidly deliver bug fixes or features.
How it’s calculated: Lead time for changes is calculated from the time a merge request is merged to the time the code is running successfully in production.
Time to Restore Service
When something goes wrong, this metric measures how fast your team can recover and restore normal service. Faster recovery times mean less downtime, which is crucial for maintaining user trust.
How it’s calculated: Time to restore service is usually measured as the median duration that an incident remains open on a production environment. It's calculated by tracking the number of seconds an incident is open, assuming that each incident is linked to a production deployment.
Change Failure Rate
Not every deployment is flawless. This metric looks at the percentage of deployments that result in production failures. A lower change failure rate indicates a more stable and healthier delivery pipeline.
How it’s calculated: Change failure rate is calculated by dividing the number of incidents that result from deployments by the total number of deployments to production over a given time period.
CubeScore™️: CI-Focused DORA Metrics Performance Analyzer
At CICube, we created CubeScore™️ to tackle the unique challenges of Continuous Integration (CI) by focusing on metrics that better assess pipeline health and efficiency. For now it works for Github Actions, other integrations for Jenkins, GitLab and Azure will be added soon.
While DORA Metrics are great for software delivery, they mainly cover Continuous Delivery. CubeScore™️ offers deeper insights into North Star Metrics for CI , helping teams measure their progress toward elite performance.
Elite teams excel in CI by maintaining efficient pipelines with minimal failures and fast recovery times. Achieving elite status means your pipelines are smooth, quick, and require little intervention.
CubeScore™️ goes beyond typical software delivery metrics, providing targeted insights that improve overall pipeline efficiency. This helps teams continuously refine their workflows and achieve top-tier CI performance.
First, what are the key CubeScore™️ North Star Metrics?
-
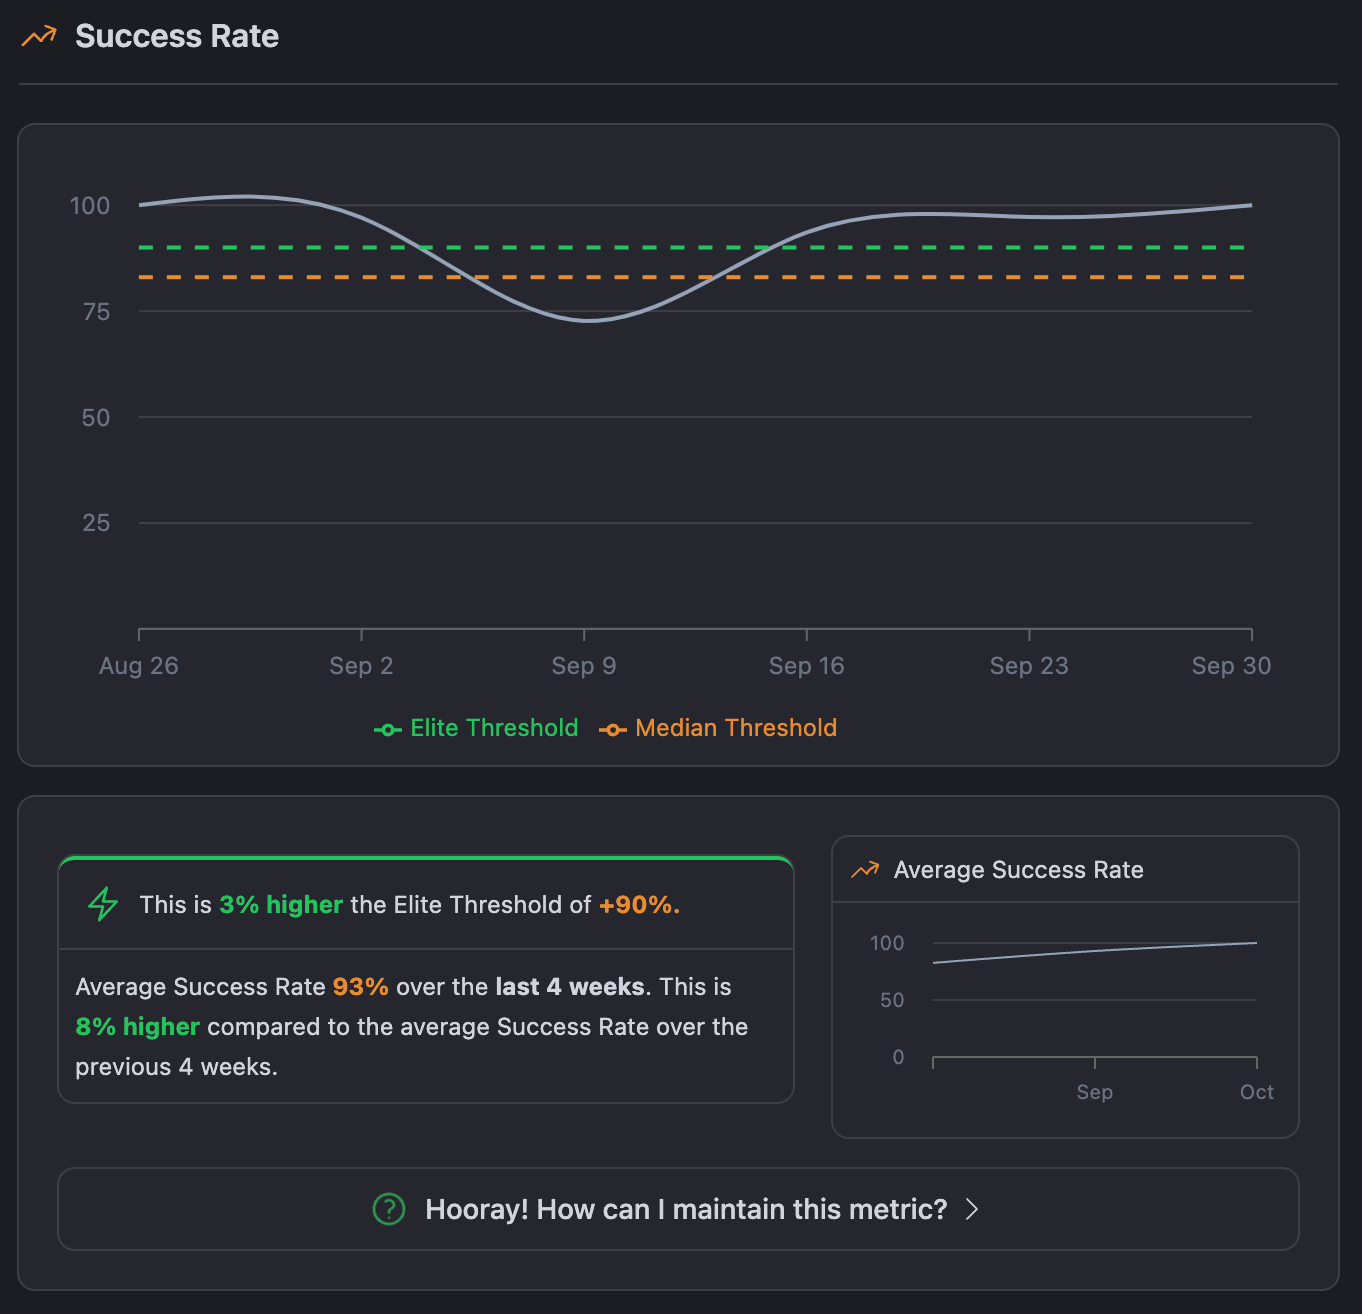
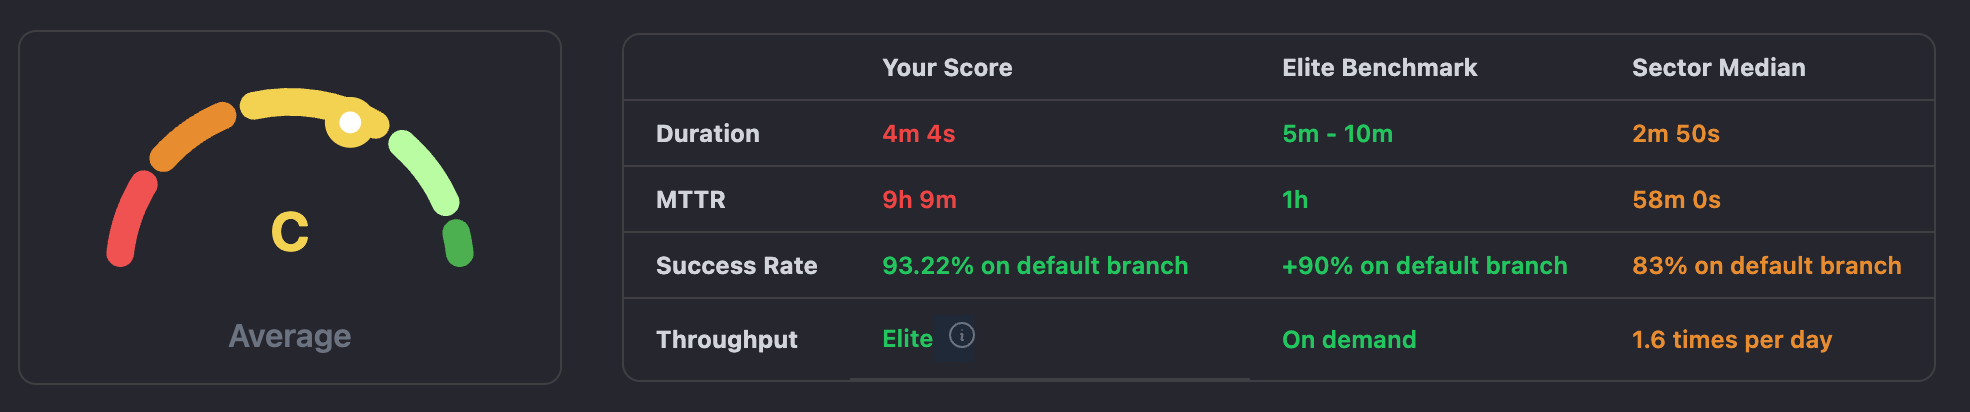
Success Rate: This will tell you how often your pipelines succeed-in other words, finish without failing. A high success rate means fewer bugs and higher ease of delivery.
-
MTTR (Mean Time to Recovery): This gives the time taken by your team to recover from a failed pipeline. The shorter this time is, the better your team is at fixing problems and moving forward.
-
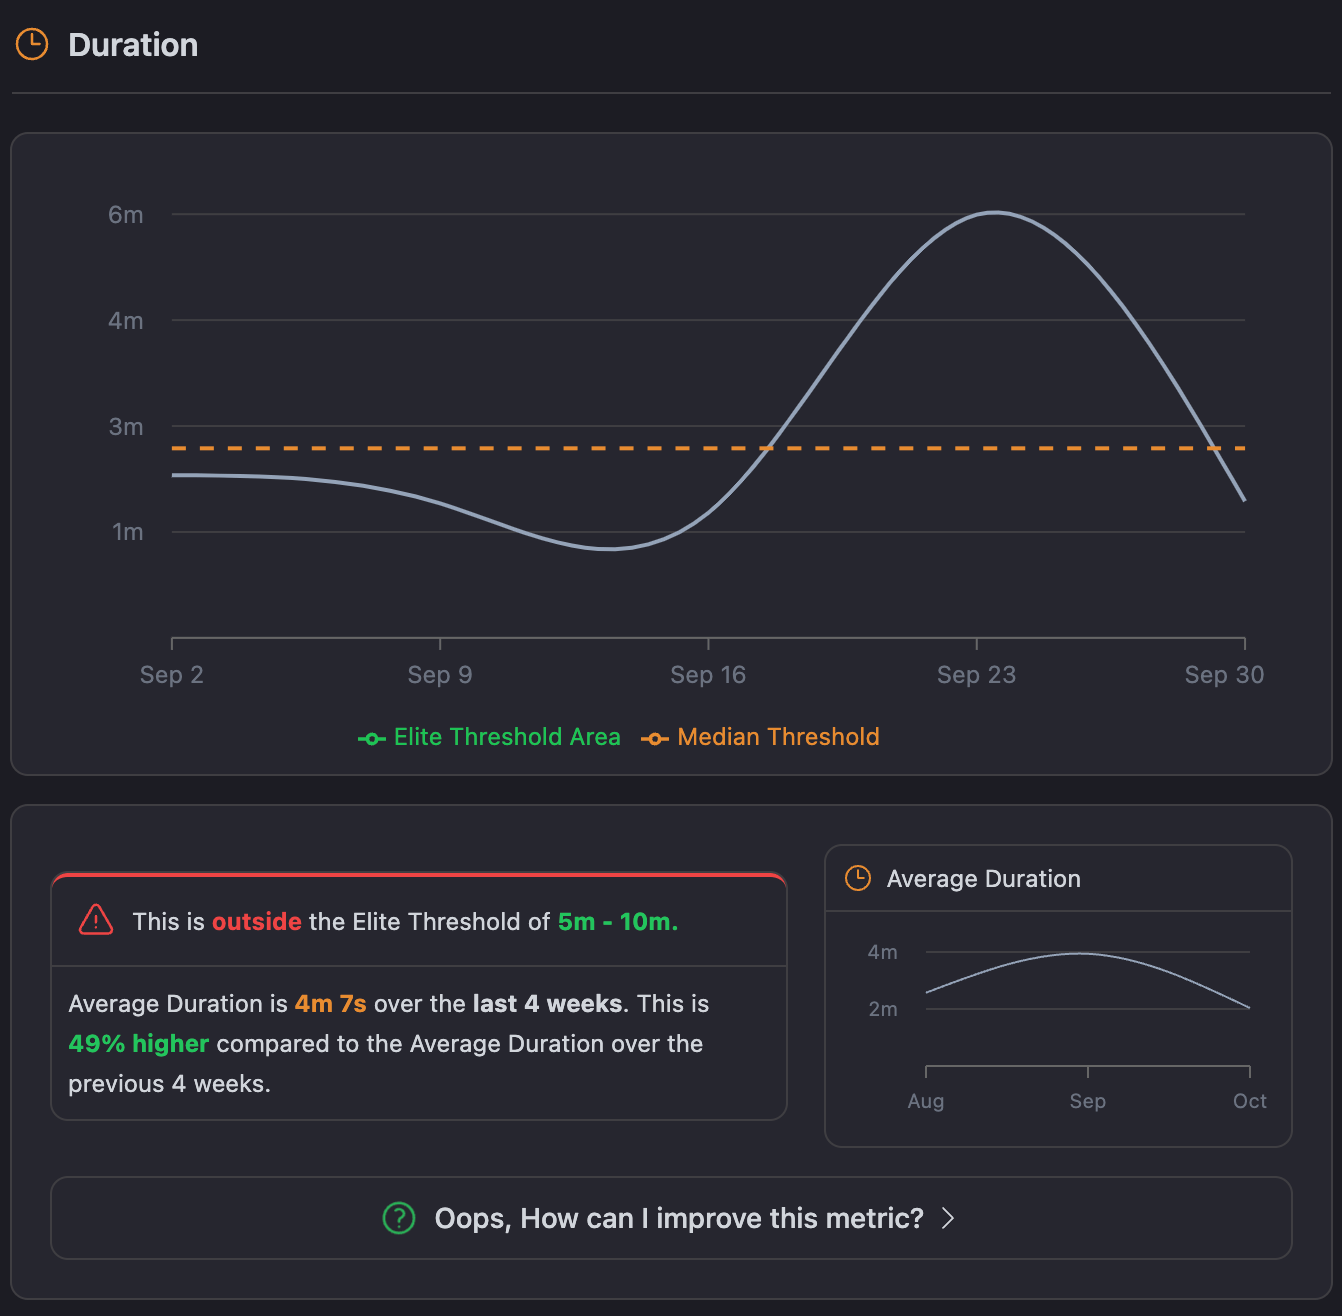
Duration This essentially measures the lead time taken for a pipeline to execute through to completion. Elite teams do this within the shortest time possible, so as to get quicker feedback and more iterations.
-
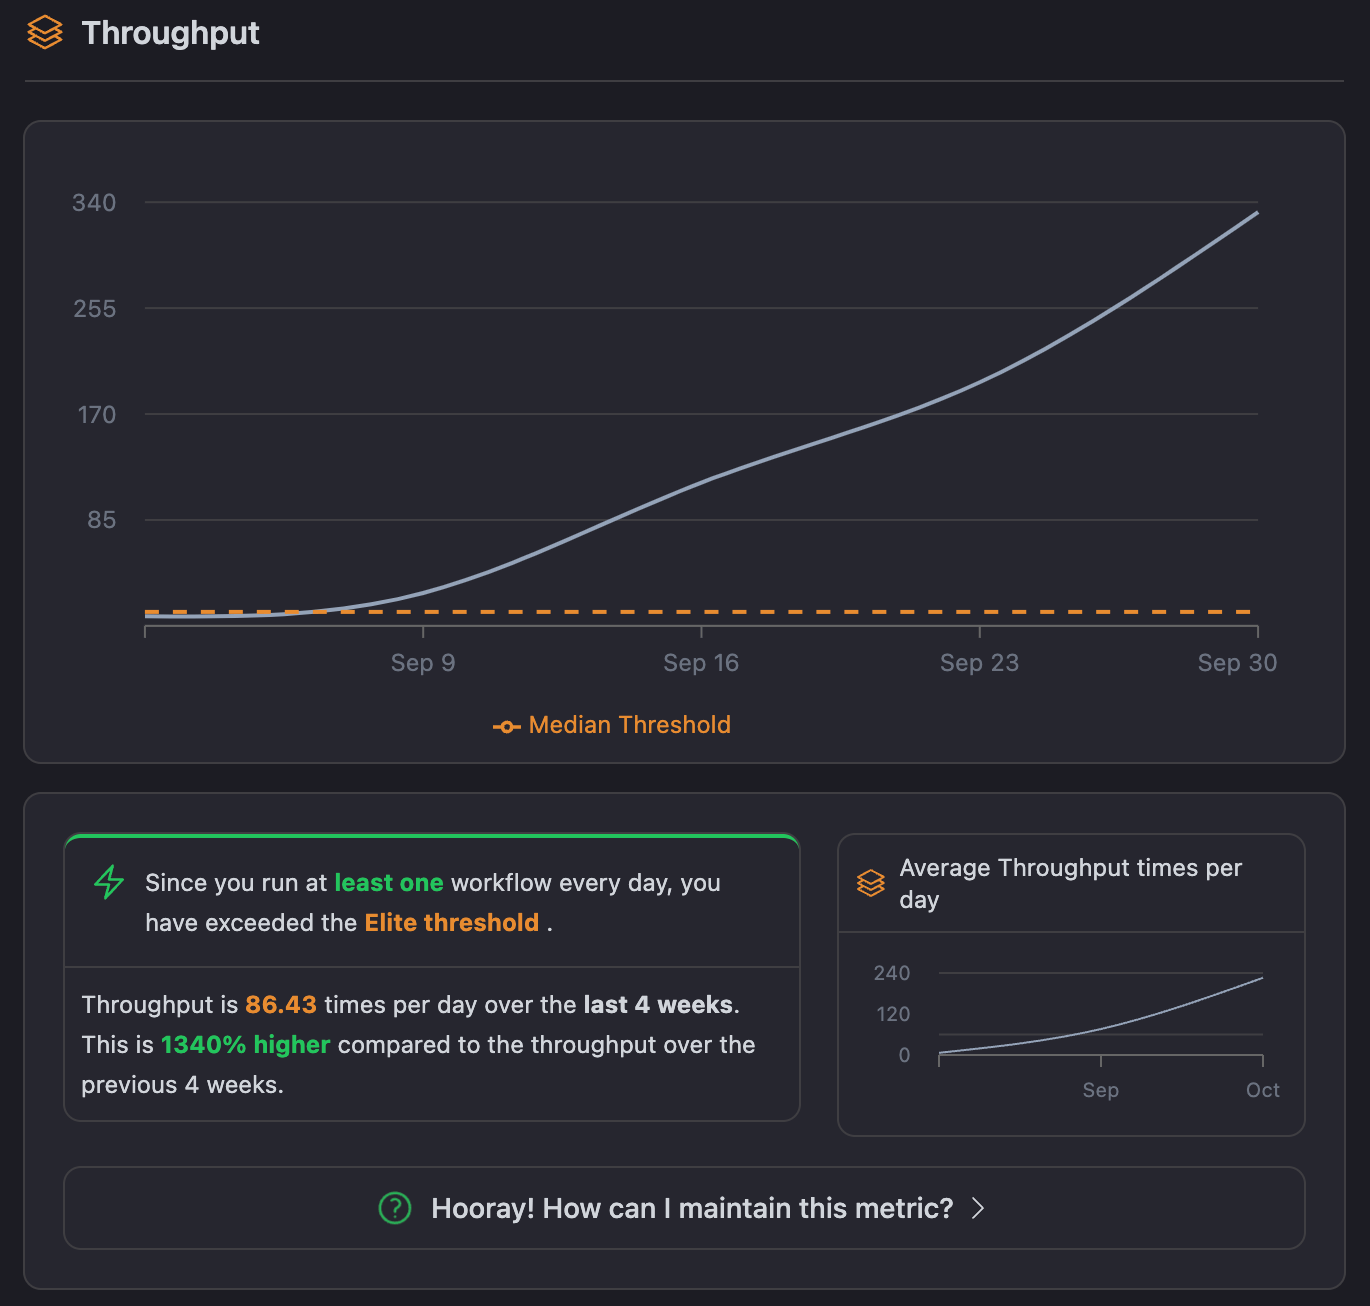
Throughput: This is the number of successful pipeline runs that your team can complete in a given time period. The higher the throughput, the more work your team manages to push efficiently through the pipeline.
While DORA focuses on a high-level view of software delivery, CubeScore™️ dives into the CI phase.
CubeScore™️ North Star Metrics: Breaking Down the Key Differences
Success Rate (CubeScore™️) vs. Change Failure Rate (DORA)
- CubeScore™️ Success Rate: The number of successful CI pipeline runs; in other words, how many of your workflows are passing.
- DORA Change Failure Rate: The percentage of changes leading to production failures, such as rollbacks and hotfixes.
Key Difference: CubeScore™️’s Success Rate focuses on the stability of the CI pipeline itself, ensuring workflows pass consistently and issues are caught early. In contrast, DORA’s Change Failure Rate monitors the quality of deployments after they’ve reached production.
Duration (CubeScore™️) vs. Lead Time for Changes (DORA)
- CubeScore™️ Duration: Measures how much time a CI pipeline takes from start to finish.
- DORA Lead Time for Changes: Measures the time taken for a code change from commit to deployment into production.
Key Difference: CubeScore™️’s Duration tracks how quickly a CI pipeline runs, providing feedback on the efficiency of build and test. DORA’s Lead Time for Changes covers the entire lifecycle from code commit to production, focusing on the overall speed of delivering new features to users.
Mean Time to Recovery (MTTR) (CubeScore™️) vs. Time to Restore Service (DORA)
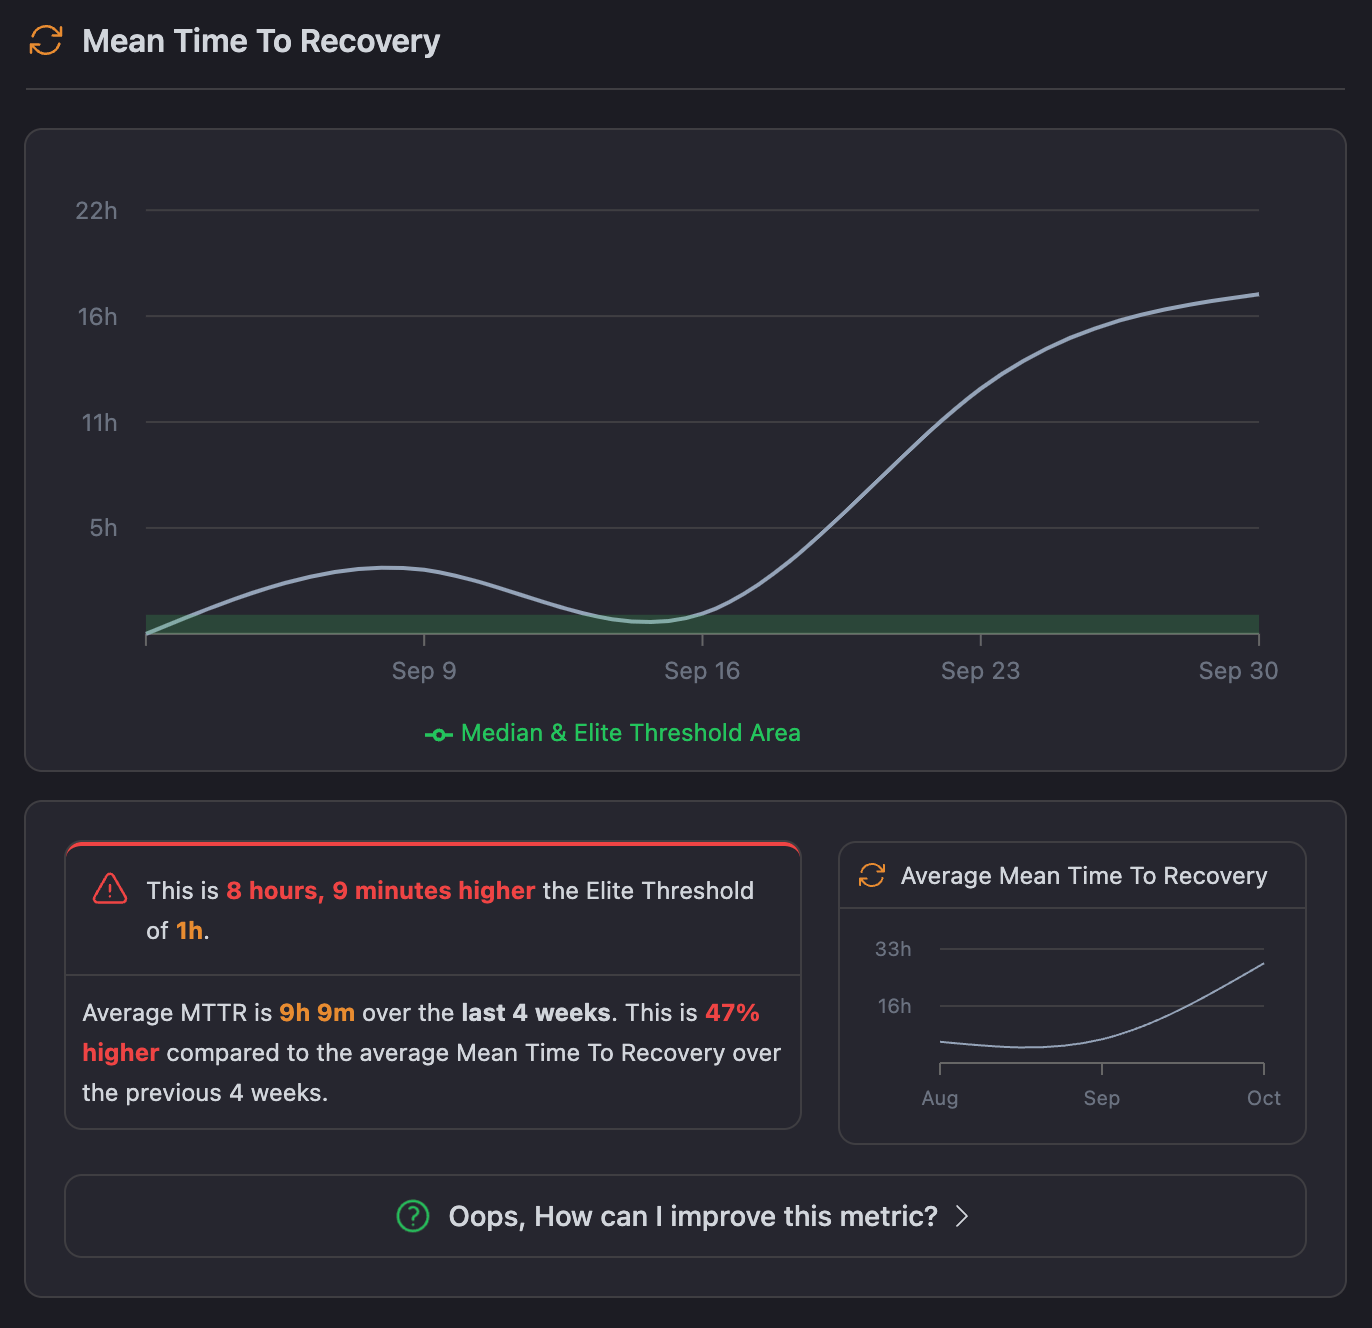
- CubeScore™️ MTTR: Measures how fast a team can recover from a failed pipeline or broken build within the CI process.
- DORA Time to Restore Service: Measures how quickly an organization can recover from a failure in production after code has been released.
Key Difference: CubeScore™️’s MTTR is specific to recovering from failures within the CI pipeline, ensuring builds are fixed promptly before code reaches production. On the other hand, DORA’s Time to Restore Service focuses on restoring service in production, measuring how quickly an organization can recover after a live failure. A low Time to Restore Service encourages innovation by allowing teams to take calculated risks with new features, knowing they can recover quickly if issues arise.
Throughput (CubeScore™️) vs. Deployment Frequency (DORA)
- CubeScore™️ Throughput: Measures how many CI pipeline runs are processed within a given time period.
- DORA Deployment Frequency: Measures how often a team deploys new code to production.
Key Difference: CubeScore™️’s Throughput focuses on the volume of CI pipeline runs, tracking the efficiency of pushing changes through the pipeline. DORA’s Deployment Frequency quantifies how frequently new code makes it to production, focusing on release frequency rather than internal pipeline efficiency.
Use DORA for overall software delivery insights and CubeScore™️ for deep CI pipeline optimization.
Why CI Needs Special Metrics?
As useful as DORA metrics are to DevOps teams, they fail to fully capture the very specific challenges of Continuous Integration: optimization of build efficiency and smooth integration of code. CI has specific challenges, and examples are as follows:
Deploy vs Integrate
DORA Metrics: It is essentially designed to point toward the frequency at which teams deploy code into production effectively. DORA prioritizes CD and deployment pipelines, rather than the CI process.
Most of the work that’s done in the CI world is with respect to the build-and-test phases.
Build Times are Ignored
Change Lead Time can be used to gauge the time it takes from a commit right from code being in production. It does not tell how long the build process really takes in and of itself.
Build time: This is one of the major bottlenecks in the CI. That is, teams should indicate, quite clearly, the metric that tracks the time taken to run tests, compile code, and create artifacts.
Without this, optimization of feedback may be a far-reaching feat since such would certainly imply that developers seemed to take a little longer to get their code changes checked in a timely manner.
Flaky Tests Not Captured
DORA Metrics cannot indicate the flakiness of the tests. Tests can be in the habit of failing and then passing without any apparent background reason.
For CI, the tests need to be reliable. Flaky tests tend to waste time by yielding false negatives and force teams to investigate issues that are not bugs. They may further cause delays in the CI process and undermine the confidence in the test suite.
Most importantly, CI pipelines need a metric for test reliability tracking—essentially, how tests are failing unpredictably—which is not something DORA Metrics focuses on.
Inability to View Pipeline Efficiency
DORA Metrics, such as Deployment Frequency, describe the frequency with which code is successfully deployed into production; however, none of them handled how efficiently the pipeline processes the work.
Speeding up the pipeline moving the code from integration to delivery depends on the levels of parallelism, allocation of resources, and the caching strategy. Optimizing CI involves understanding and improving the efficiency of such processes, which DORA Metrics do not cover.
Inattention to Loops of Feedback
CI is all about fast feedback. The sooner a developer gets feedback about their code, the sooner they can fix problems and move on.
Although DORA’s “Time to Restore Service” measures how long it takes to recover from a production failure, it doesn’t capture how quickly developers are receiving feedback during the CI process itself. This keeps the distinction clear between DORA’s focus on production recovery and the need for faster feedback loops in CI processes.
Key metrics dedicated to feedback loop duration—that time between a pipeline starting and providing meaningful results to developers—are missing but important in CI within the DORA framework.
Narrow Approach Towards Testing
DORA Metrics cannot show what types of tests run specifically, such as unit tests, integration tests, and end-to-end tests, and how they fare individually. In CI, different test stages have different contributions to the general health of the pipeline.
For instance, end-to-end tests may take considerably longer to run compared to unit tests; however, they can also be much more prone to catching critical bugs. Knowing how various types of tests are influencing the CI process is key to finding a balance between speed and test coverage, with DORA Metrics not providing that level of detail.
Bottleneck Detection
One of the biggest pains regarding CI is trying to find where bottlenecks are happening.
Is it during the build process?
Is it some test suite that takes too long to execute? Or is it because of external dependencies, such as third-party services?
DORA metrics takes a further lead with the end result, that is, at what speed teams deploy and recover but don’t give insight as to where things might be slowing down in which part of the CI pipeline.
Why CubeScore™️ Steps In?
CubeScore™️ was designed to address the gaps left by DORA Metrics when it comes to CI(continuous integration). It gives teams actionable insights into their pipelines, helping them improve build times, recovery times, and overall efficiency.
DORA Metrics are invaluable for tracking software delivery performance, but they don’t fully capture the intricacies of CI. CubeScore™️ fills this gap by providing detailed metrics specifically for CI, enabling teams to optimize their integration pipelines and ensure a smoother, faster development process.
How to Use CICube and CubeScore™️ to Optimize CI Pipelines
Optimizing CI pipelines can get complicated fast, but using CICube and its CubeScore™️ metrics makes it much more manageable. It gives me clear, data-driven insights into what’s going wrong (or right) in our CI process. Let me walk you through how we��’ve been using CICube to improve our pipelines.
Proactive Monitoring and Insights
CICube’s real-time dashboard provides a comprehensive overview of key CI performance metrics, specifically designed to track how well your pipelines are running through CubeScore™️ North Star metrics which give you deep insight into your GitHub Actions workflows, making it easier to identify areas for improvement.
With actionable insights, even non-CI experts can benefit from AI-driven recommendations that address issues like decreasing success rates, increasing durations, or test failures. By monitoring these key metrics in CICube’s dashboard, you can quickly detect performance dips and address them before they escalate into larger problems.
Weekly reporting
Produces a weekly report summarizing key metrics, alerts, and trends from the past week. Reports like these keep you updated on your infrastructure's health and performance through highlighting the important activities and possible issues that you don't have to keep an eye on every now and then.
Improving Pipeline Success Rate
Success Rate is one of the most critical metrics in any CI pipeline—basically, it’s how often our runs succeed without errors. With CubeScore™️, we track this over time and quickly spot any patterns.
For example, if our Success Rate drops below a certain threshold, I can see exactly which tests or steps are causing failures. From there, it’s easy to:
- Debug flaky tests that cause false failures (those are the worst!).
- Adjust resources if certain pipeline stages are bottlenecked.
- Ensure critical tests aren’t skipped so our main branch stays deployable.
With that kind of visibility, I know exactly where to focus fixes to keep things stable.
Reducing Pipeline Duration
Long pipeline times can be a killer for developer productivity. With CICube’s Duration metric, I can easily pinpoint inefficiencies in the pipeline and figure out what’s slowing things down.
For example, if our pipeline runs are taking too long, I can dig into the Duration metric to:
- Identify slow steps: CICube breaks down each stage—build, test, artifact generation—so I can see where the bottlenecks are.
- Optimize resources: If certain stages are struggling due to limited resources (like test environments or build servers), I know where to allocate more.
- Leverage parallelization: Running tests or builds in parallel is a great way to reduce pipeline time, and CICube helps highlight where I can do this.
By continuously fine-tuning using CubeScore™️’s Duration metric, I’ve managed to shave off some serious time from our pipelines, giving developers quicker feedback.
Continuous Feedback Loops for Ongoing Improvement
What I love about CICube is the constant feedback loop it creates. As CubeScore™️ metrics update in real-time, I can catch issues early and use the data to drive continuous improvements in our CI process.
For example:
- If our MTTR is consistently high, CICube flags it, letting me dig into why it’s taking so long to recover from failures. This could lead to faster notifications or smaller, easier-to-fix commits.
- If the Throughput metric drops, it’s usually a sign that something is slowing down the pipeline, like a test bottleneck. CICube gives me the data I need to identify where things are stalling and fix it.
By continuously monitoring and tweaking based on these metrics, our team is always improving. The best part? We’re not just fixing issues when they pop up; we’re proactively making our pipelines better with each iteration.
Finally
I’d love to hear your thoughts! What metrics have you found most useful for measuring CI performance in your team? Do you think traditional DORA Metrics cover everything, or is there something missing when it comes to optimizing CI pipelines?
Let’s also discuss: Are there other metrics—whether from DORA, CubeScore™️, or maybe a new approach altogether—that could give a more complete picture of CI health and performance? Feel free to share your experiences and ideas!