Introduction
One of the most overlooked aspects when using GitHub Actions is tracking the status of builds and workflows. Many DevOps professionals don’t pay attention to CI statistics because it can be difficult to track and they may not know exactly what to look for. For example, if your success rate is 70%, is that good or bad? Similarly, when you look at the duration of your workflows, is an 8-minute workflow acceptable? What’s the industry standard? Let's take it a step further: how long does a failed workflow take to recover and succeed? Ideally, this should happen in under 60 minutes—are you tracking this?
Monitoring, Learn, and Optimize
If you’re not monitoring your CI metrics, it’s hard to optimize your CI processes and make your development workflow more efficient. Recently, the concept of "Elite Software Teams" has been gaining popularity. These teams have streamlined processes with minimal friction, allowing them to release new features more frequently. In fact, elite teams deploy 70% more features in the same timeframe compared to other teams.
So, which CI metrics should we be tracking? You may have heard of DORA metrics in software development. These include Deployment Frequency, Change Lead Time, Change Failure Rate, and Time to Restore Service.
For CI workflows, we believe the key metrics are:
- Duration of Workflow Runs: Measures how long it takes for a pipeline to complete. Elite teams aim to keep this duration short for faster delivery.
- Success Rate: The percentage of successful pipeline runs on the default branch. Higher success rates mean fewer failures and less downtime.
- Throughput: Tracks how many pipeline runs are completed within a set period. High throughput indicates that teams are delivering more work faster.
- MTTR (Mean Time to Recovery): Measures how quickly teams recover from a failed workflow. Elite teams resolve issues quickly to minimize impact.
How can you track these metrics?
Many CI systems offer APIs that can help you collect this data. For example, GitHub Actions has an API for fetching workflow run data: GitHub Actions API.
Alternatively, you can use CICube, which provides easy access to all these metrics and more. With CICube, you can track CubeScore (DORA metrics for DevOps teams) and receive weekly email reports to share with your team. The CubeScore™️ feature gives you a historical view of your CI metrics, making it easier to spot trends and optimize your workflows.
Success Rate of React Repository on GitHub Actions
For example, let’s take a look at the success rate of workflows running on the default branch of the popular frontend library, React. We can evaluate how their CI optimizations are performing and explore potential improvements.
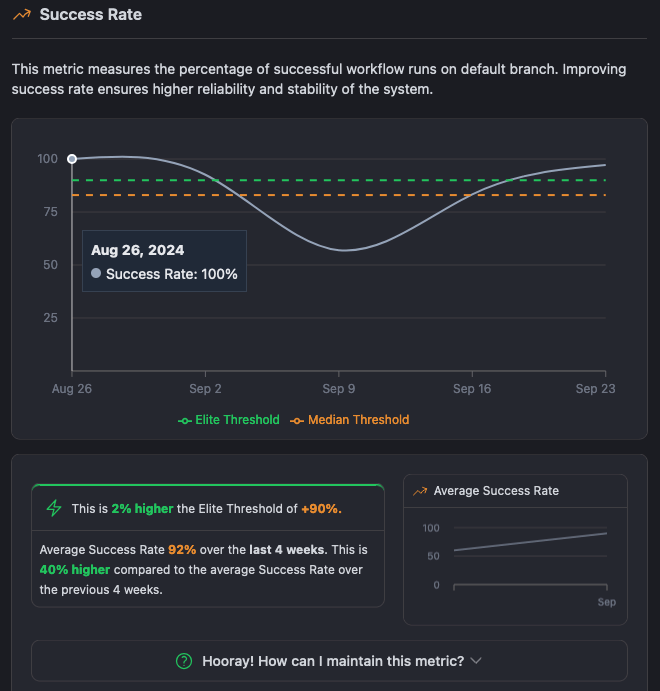
Upon reviewing the results, we observe that they have a 92% success rate and have successfully reversed a downward trend in their success rate. Congratulations to the React core team!
If you’d like to take a closer look, you can check out the React repository’s CI metrics by clicking here to explore their GitHub Actions in detail. And if you want to create similar metrics for your GitHub actions workflows, feel free to sign up and get started for free!
How we calculate CubeScore™️
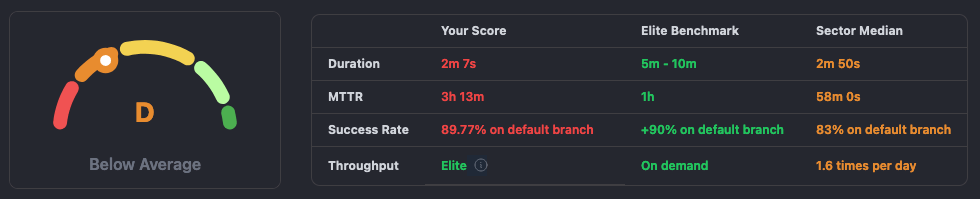
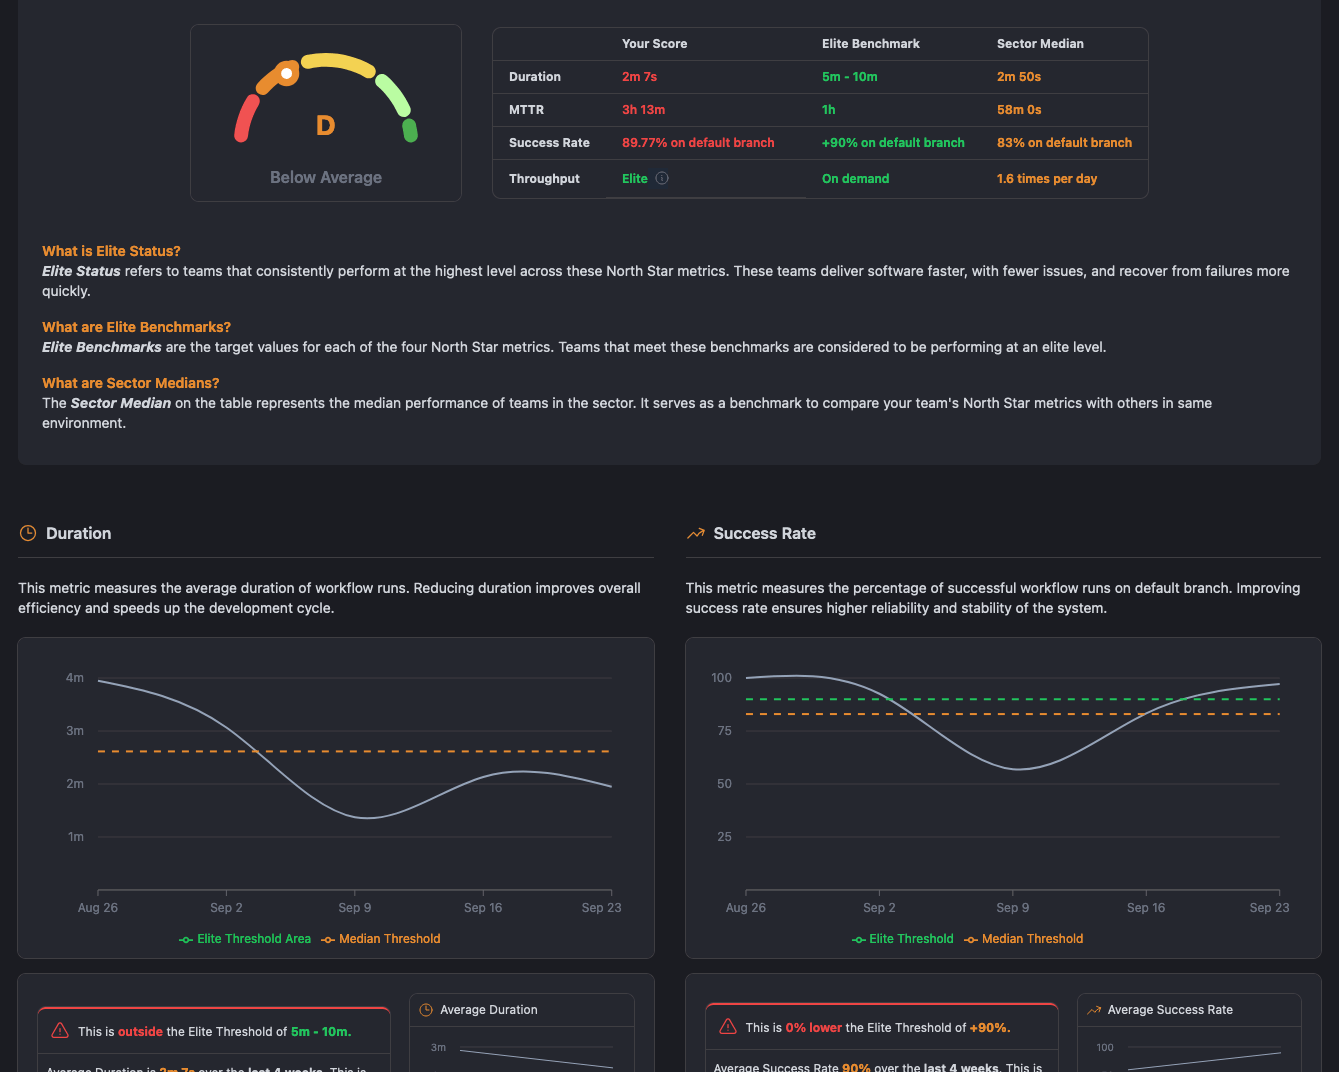
CubeScore™️ is a metric designed to assess the efficiency of a team's CI lifecycle. It benchmarks your CI process against industry standards, using the following metrics:
- Duration of Workflow Runs: Shorter durations mean faster feature delivery.
- Success Rate: A higher success rate on the default branch minimizes downtime.
- Throughput: Higher throughput shows that the team is moving quickly and efficiently.
- MTTR (Mean Time to Recovery): Fast recovery from failures ensures minimal disruption.
Monitoring and optimizing these metrics helps teams improve their CI processes, leading to faster recovery times and better performance overall. CICube tracks your performance and provides insights and actionable recommendations to help you reach Elite Status.
Conclusion
Tracking and optimizing CI metrics is essential for maintaining efficient, reliable, and fast development workflows. Metrics like workflow duration, success rate, throughput, and MTTR offer valuable insights into the performance of your CI pipelines. By actively monitoring these metrics, you can identify bottlenecks, reduce failures, and speed up recovery times, ultimately pushing your team towards elite performance.
Using tools like CICube makes tracking these metrics easier, allowing you to make data-driven decisions that enhance your CI processes.