AI-Powered Actionable CI Insights
The Insights section, powered by advanced AI analytics, gives you a quick overview of key CI pipeline metrics and highlights any changes that might affect performance. It's set up to help DevOps teams spot and fix bottlenecks fast, keeping the CI process running smoothly and efficiently.
Insights Overview on the Dashboard
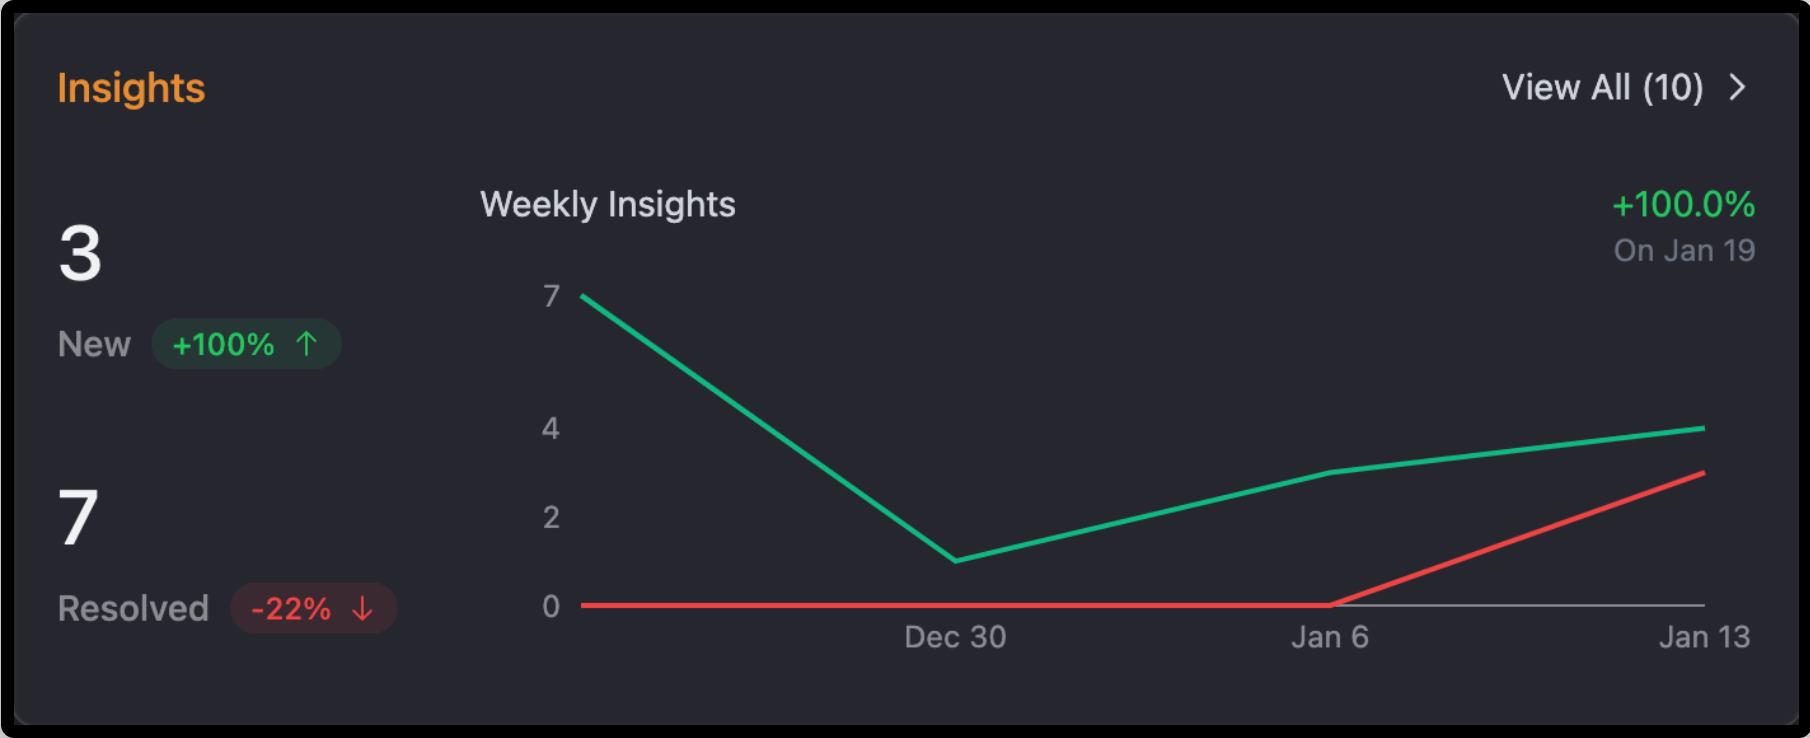
The AI-driven Insights overview card offers a glance at actionable insights in the last week of your pipeline. This card helps DevOps teams stay ahead by easily tracking emerging and resolved issues for better workflow management and prioritization.
Benefits for DevOps Teams:
Track Issue Trends:
Leverage AI-powered analytics to quickly determine whether the occurrence of unresolved issues is growing and make a rapid intervention.
Performance Evaluation:
Compare the resolved ones against the newly detected issues through intelligent metrics to judge how efficient the team has been in addressing pipeline problems.
Easy Prioritization:
Focus on high-priority insights automatically identified and ranked by our AI system, keeping an eye on the trend.
The Overview card helps keep you atop pipeline health through AI-powered actionable trends, delivered at a high level.
What Are the Insight Rules?
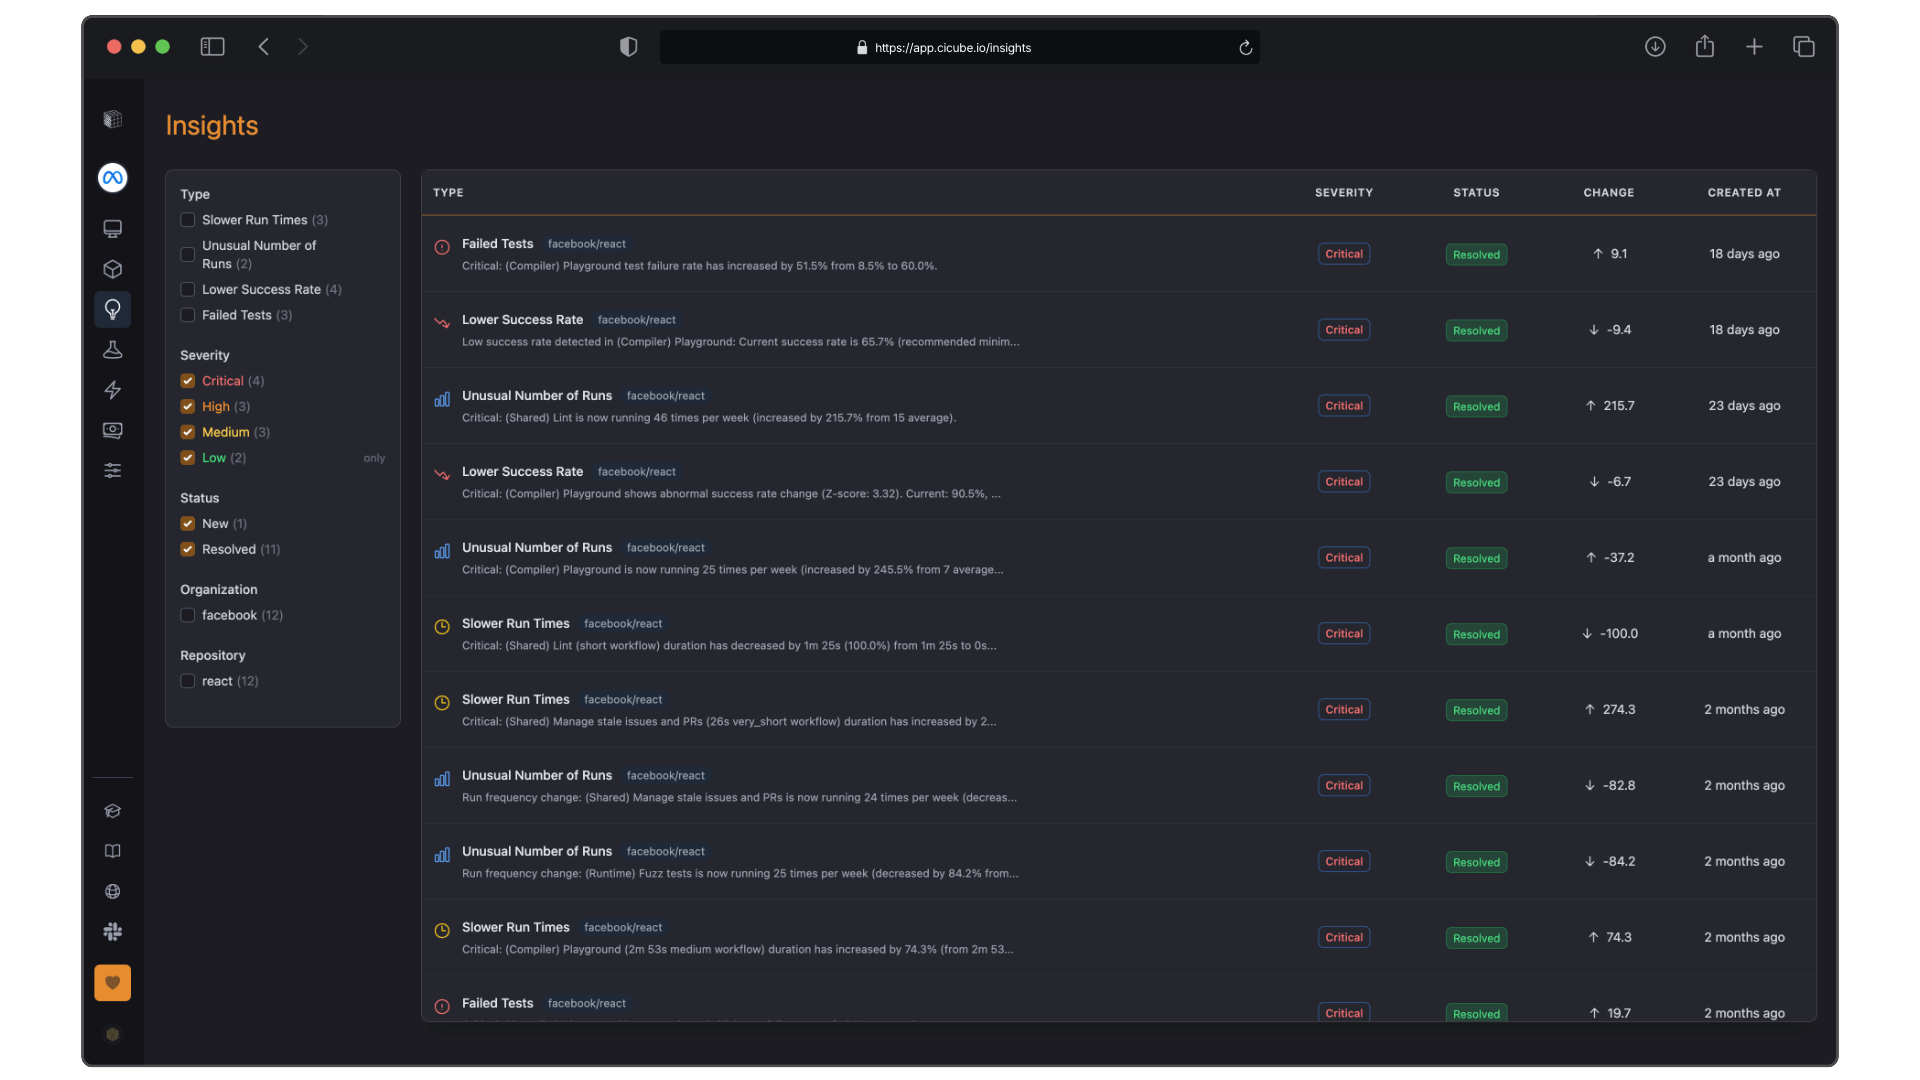
Slower Run Times
Tracks workflows taking longer than usual to complete.
Longer runtimes can slow down development and feedback loops. This helps pinpoint inefficiencies like slow builds, resource limits, or long test durations.
Unusual Number of Runs
Monitors workflows with unexpected activity spikes or drops.
Too many runs might indicate misconfigured triggers, while too few could mean missed schedules. This rule ensures a balanced CI activity.
Lower Success Rate
Highlights workflows with decreasing success rates.
A drop in success rate means more failed runs, creating delays and instability. This helps teams catch flaky tests or config issues early.
Failed Tests
Flags workflows with frequent test failures.
Repeated failures could indicate poor test quality or unstable code. Fixing these ensures CI reliability and reduces debugging effort.
Detailed View of Each Insight
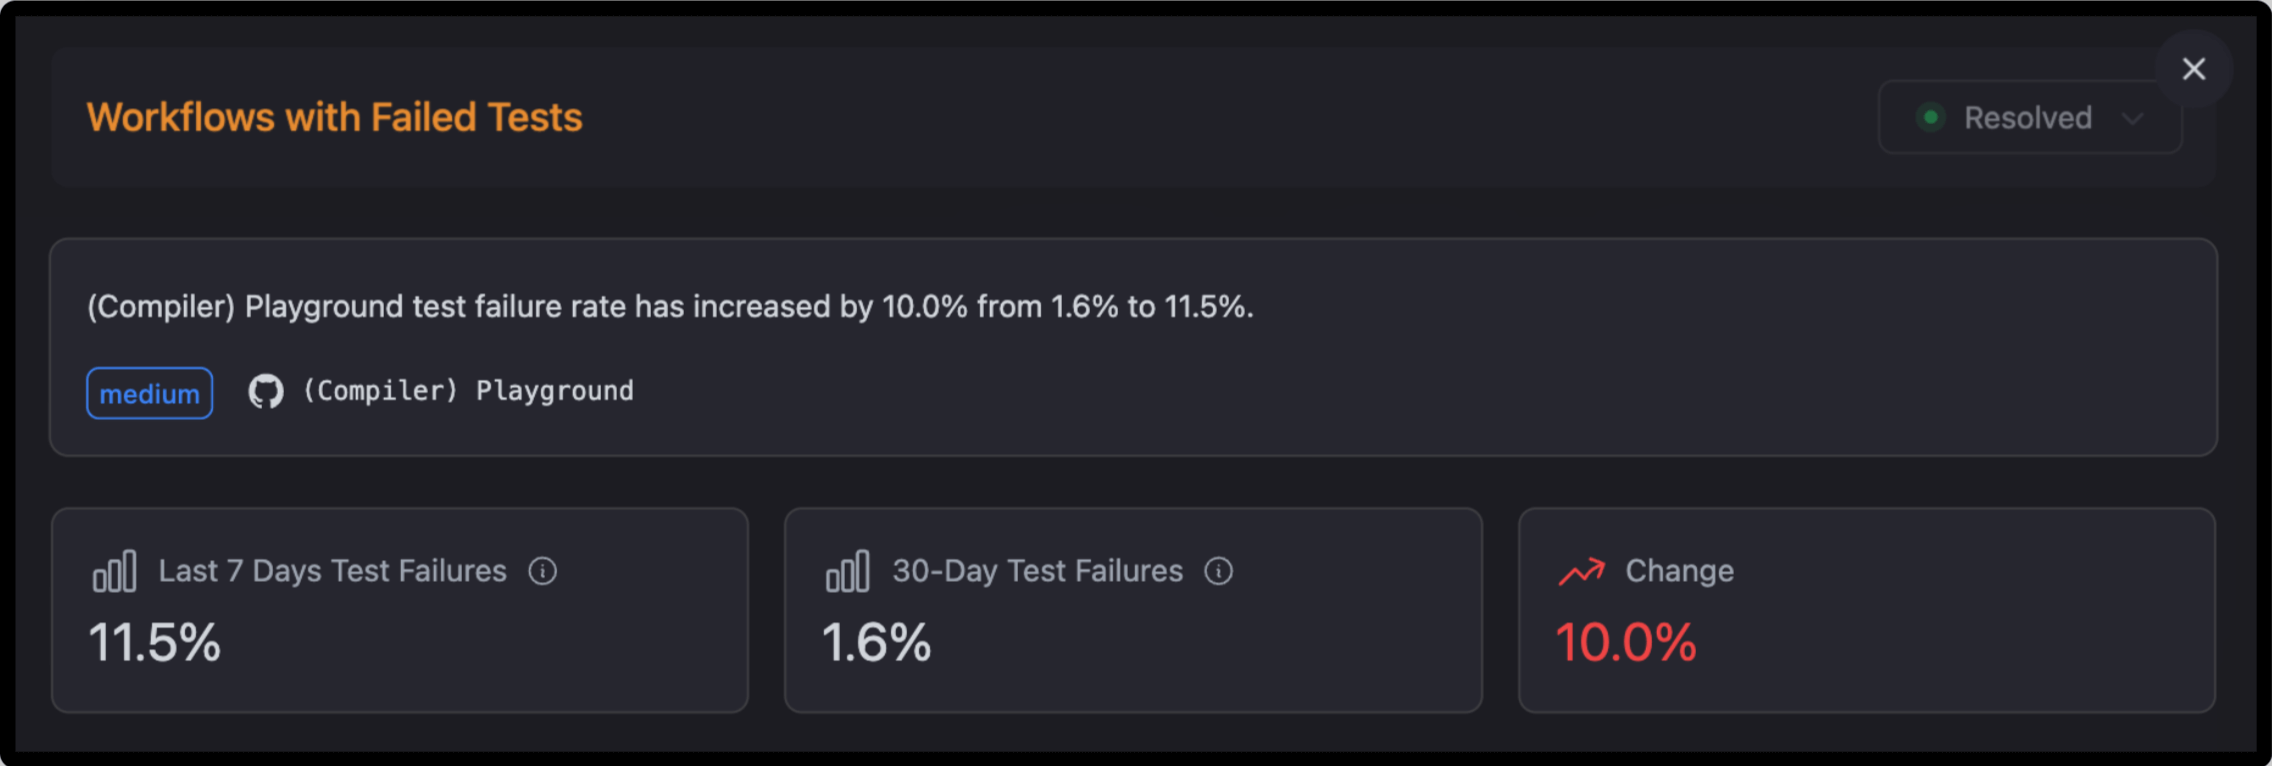
Clicking on the insights will provide you further breakdowns of what is going on.
For the insights above, the Key Metrics are:
- Test FailuresLast 7 Days: How the workflow has performed recently.
- 30-Day Test Failures: A longer-term view of failures.
- Change Percentage: It calculates the percentage increase or decrease in the failed tests rate.
Performance Chart:
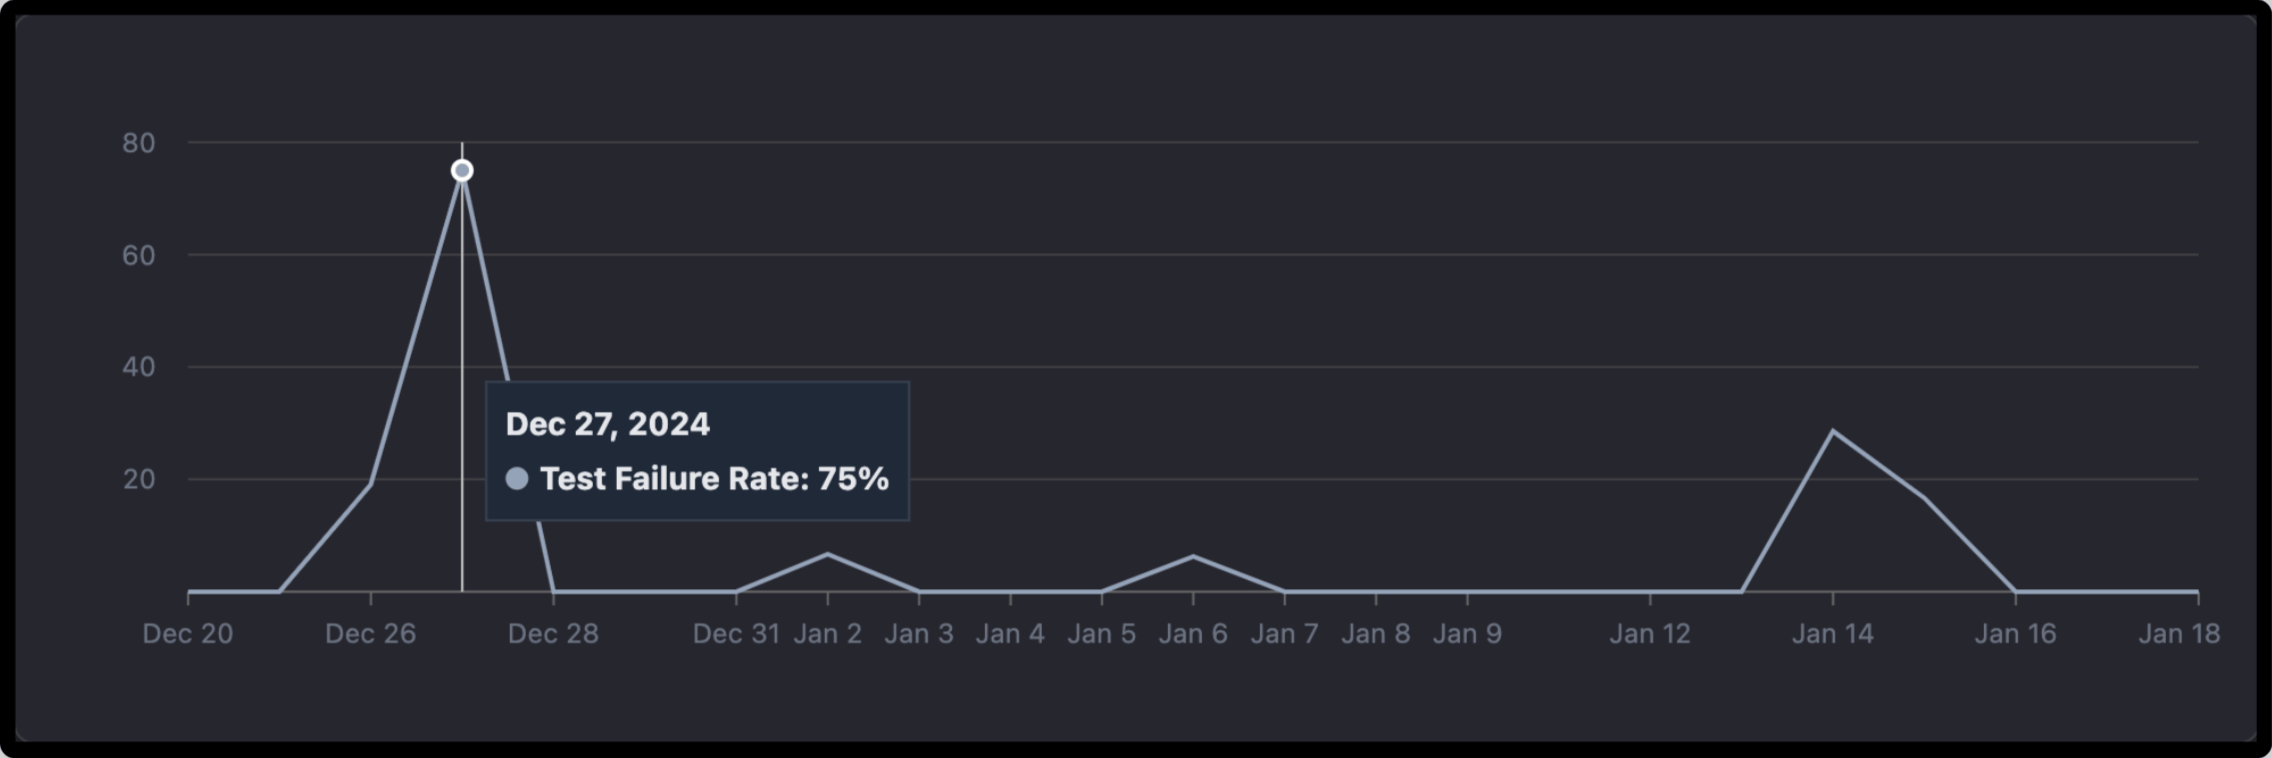
- A timeline graph shows how the workflow's success rate has changed over time. You can identify patterns, hence determine when problems started.
Run Information
It displays recent runs that contributed to the metric change, enabling you to trace issues back to specific commits, branches, or contributors.

AI-Driven Suggestions for Improvement
It also provides actionable recommendations powered by AI, aimed at enhancing the metric's performance to stay within Elite thresholds.
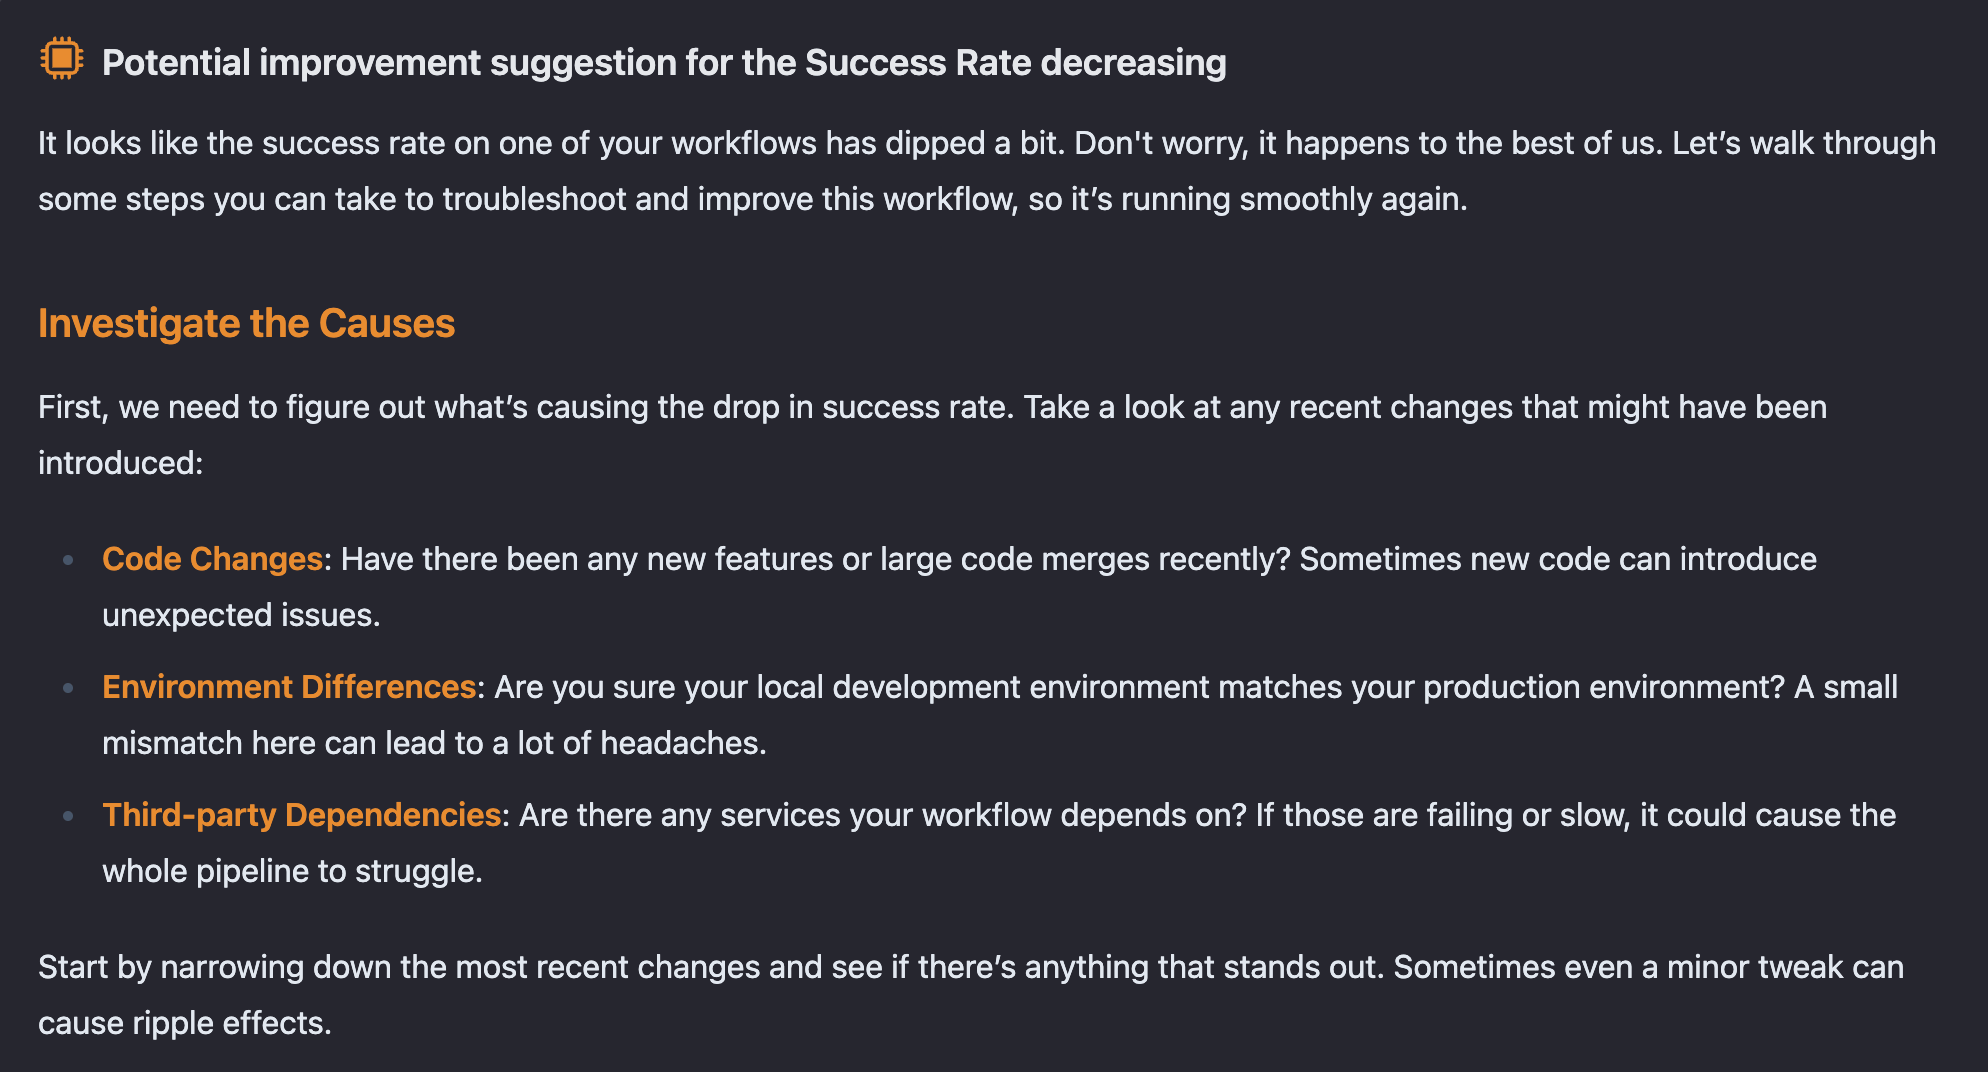
The Optimization & Suggestions section offers AI-driven recommendations to improve your workflows. This is particularly useful if any of your pipelines fall below Elite thresholds, listing workflows with potential performance issues and suggesting specific actions to get them running more smoothly.