Top Slowest Jobs Table
The Top Slowest Jobs table provides the clearest view of the slowest job execution occurring on your CI pipelines.
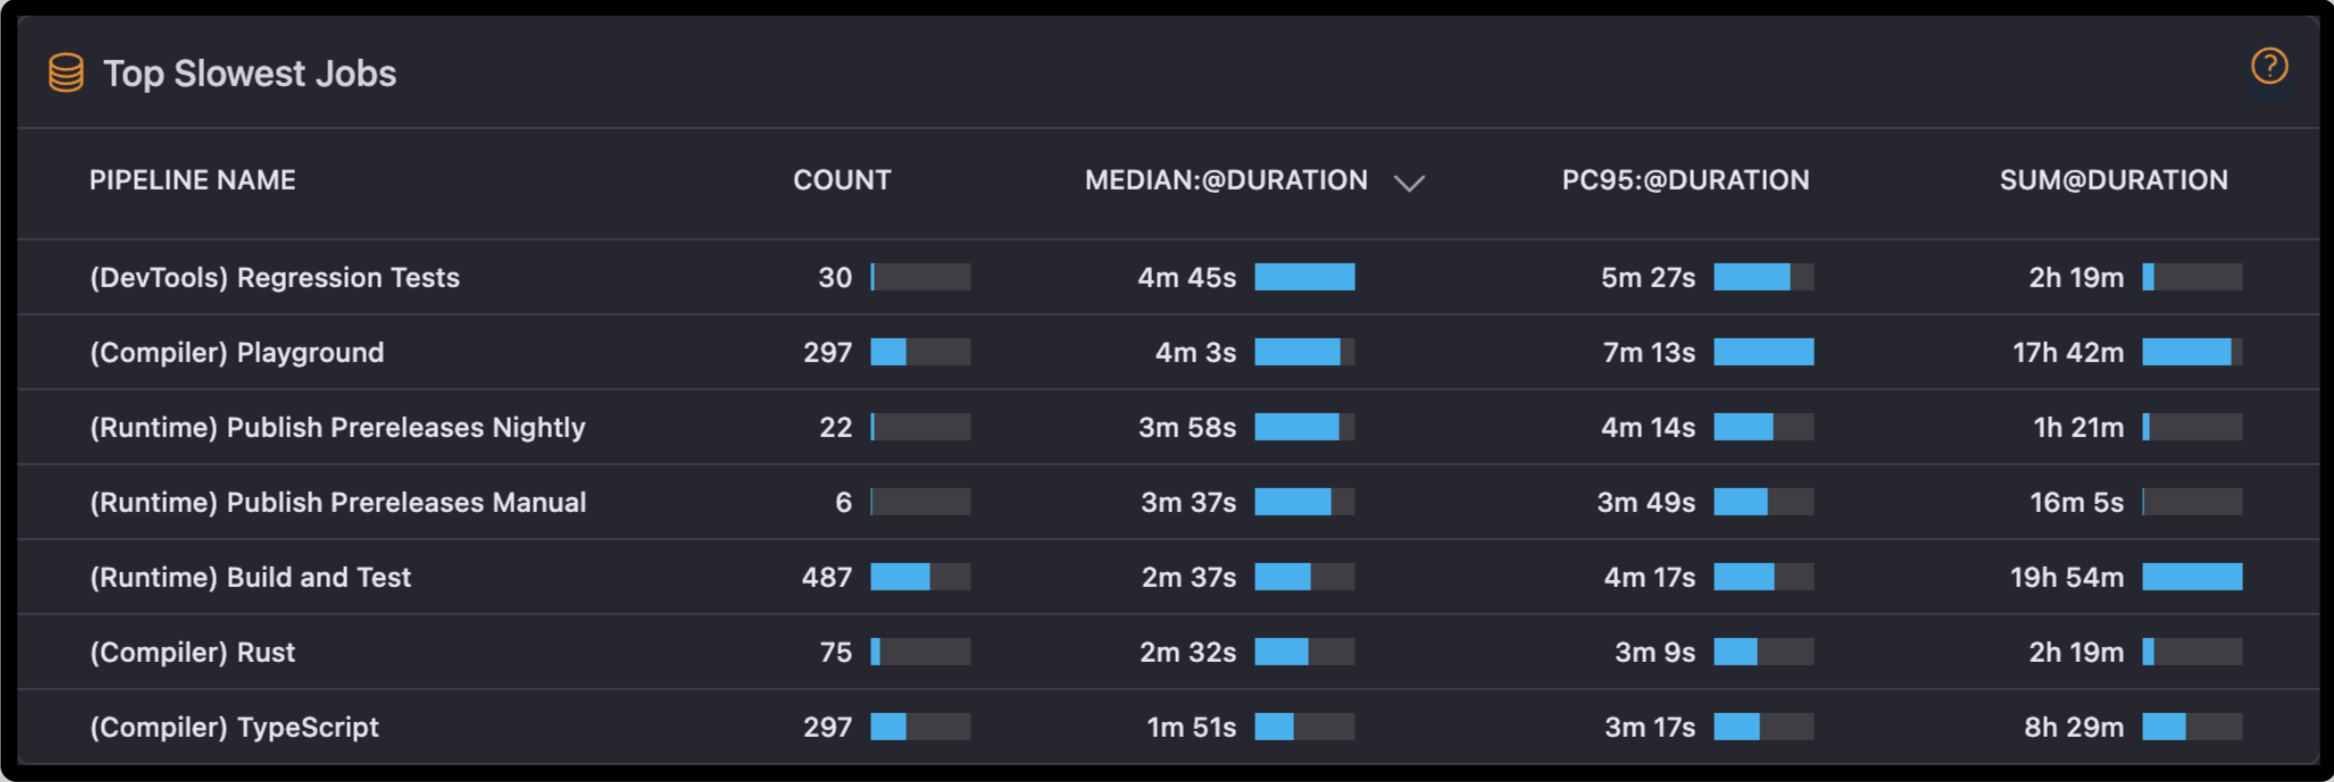
It drills down to the level of showing every vital detail such as how many times they ran, how much time each used to execute, the total aggregate, time consumption, which becomes indispensable for every DevOps team desiring to solve bottlenecks and make the workflows faster and leaner.
- Find Bottlenecks: Observe the jobs that require the most time and attempt to correct them.
- Resource Planning: Use execution counts and total durations to plan resources where they are needed most.
- Track Progress: Observe how these numbers change over time to see if your optimizations are in the right direction.
- Set Alerts: Establish the limits of duration and set alerts for jobs running for too long.
- Easier Debugging: Quickly locate the slowest jobs and eliminate the reasons for it.
- Faster Pipelines: Reduce very long job durations; speed up feedback and deployments.
- Better Resource Use: Optimizing heavy jobs saves resources and improves efficiency.
- Stay on Track: Slow Job Fixes help ensure that your Pipelines meet performance goals and standards of the SLA.
Key Metrics
Job Count
This gives you an overview of how many times the given job has run in the provided time range. Jobs that run a great amount and take too much time will really slow it down.
Pay attention to jobs with high count and long duration for speeding up your pipelines.
Median Duration
The median duration is the middle value of how long it takes for a job to run. It gives a good idea of what the typical runtime looks like. Jobs with a high median duration may be inefficient or poorly configured.
Search out jobs above average duration and determine what is causing the delay in each.
95th Percentile Duration
This will show you the longest 5% of job durations, giving a sense of near worst-case scenarios while ignoring extreme outliers. These slow jobs can cause big delays in your pipelines and impact your team's productivity.
Identify which jobs routinely fall into this category Optimize them by using caching, parallelization, or better resource allocation
Total Duration
This sums up the total time each job has taken across all its runs during the period. Jobs with high total durations can consume a lot of resources and slow down overall pipeline performance.
Use this data to figure out which jobs cost the most time and prioritize improving them.