Pipeline Costs

The Cost Page allows DevOps teams to track and understand the spending of their Continuous Integration pipelines and resource usage. It clearly shows how much you spend, how many minutes you use, and how well you use resources. In this way, you are able to work out your best cost and improve pipeline performance.
Charts
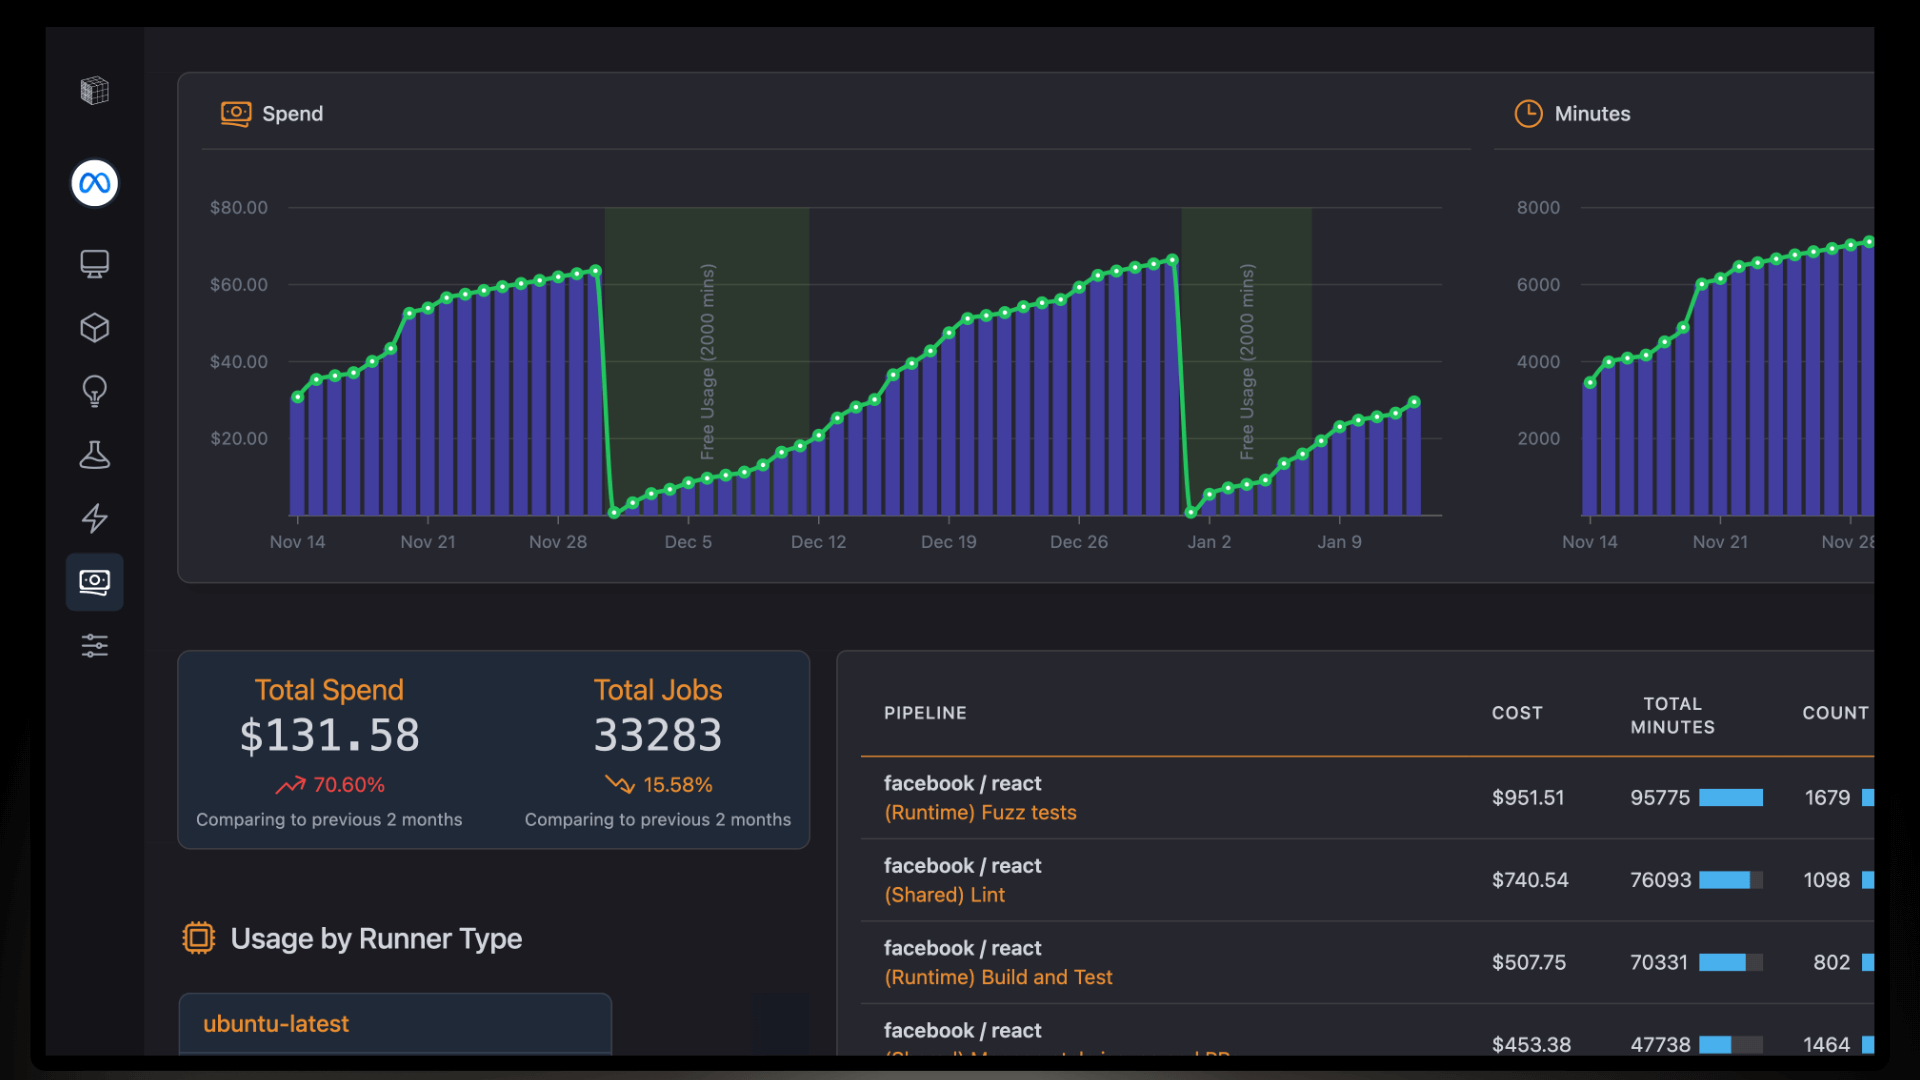
This page gives you two critical charts:

Spend Chart
Follows your spending over time, showing when you're within free usage limits, such as 2000 free minutes, and when you're accruing costs.
- Blue Bars: Represent day to day expenditure
- Green Line: Accumulated sum of spend
- Free Usage Zone: Indicates periods covered by free usage(GitHub Actions Free Tier)
Minutes Chart
Tracks the number of minutes used by your pipelines over time.
- Similar display as the Spend Chart, only it has day by day bar chart for usage and line for all-time totals
These reports enable you to monitor cost trends and identify usage or spending spikes.
Key Metrics

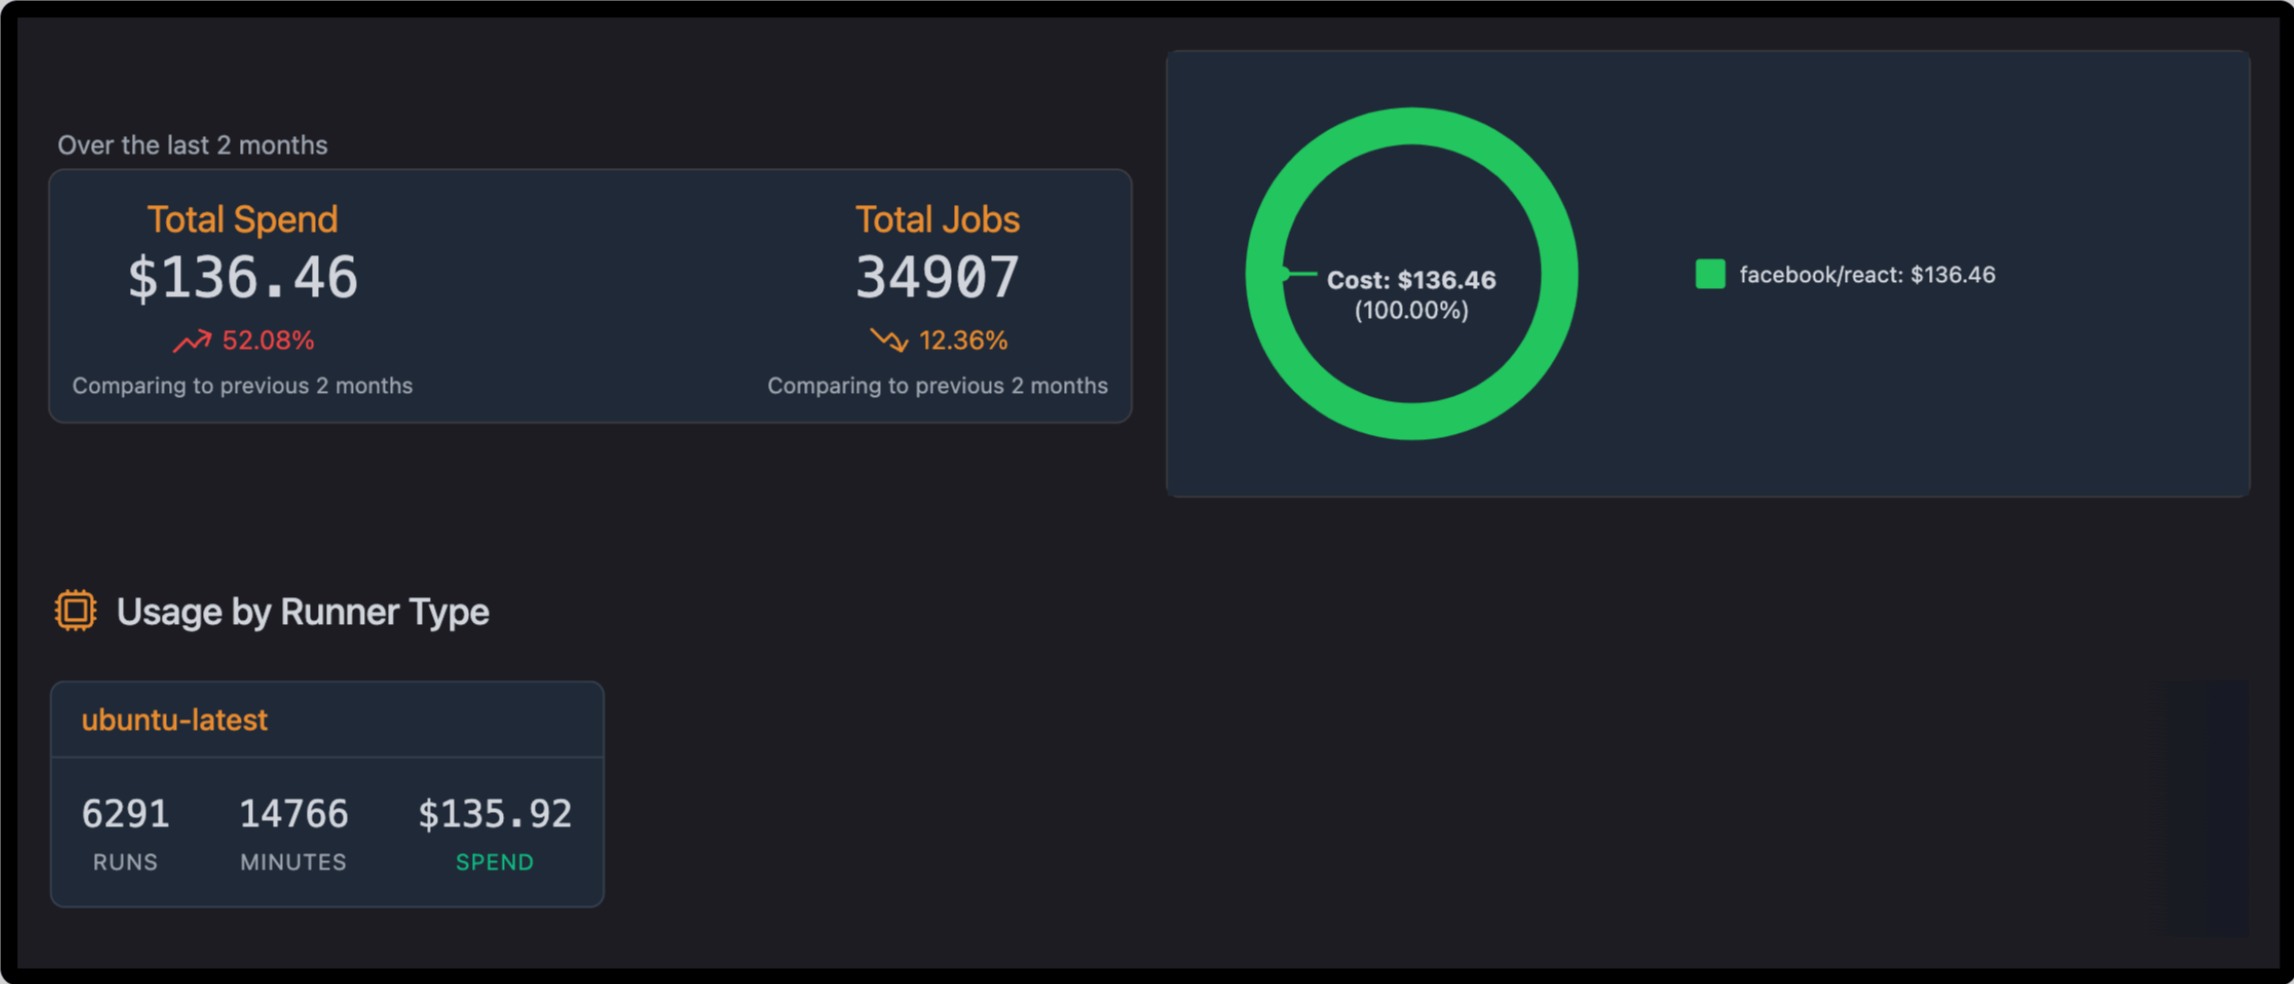
Total Spend
The sum of all pipeline execution costs in the chosen time interval.
- Contains the percentage change over the previous period
- Total Jobs: The total number of jobs executed during the selected period
- Includes also a comparison with the previous period
Usage by Runner Type
This table outlines resource consumption, by type of runner. Example:
- Runs: Count of executions on each type of runner, for example, ubuntu-latest
- Minutes: Total time spent running jobs
- Spend: Total cost to be used for each type of runner
Use this information to find out which are the most expensive runners so that optimization efforts can be directed there.
Pipeline Cost Table
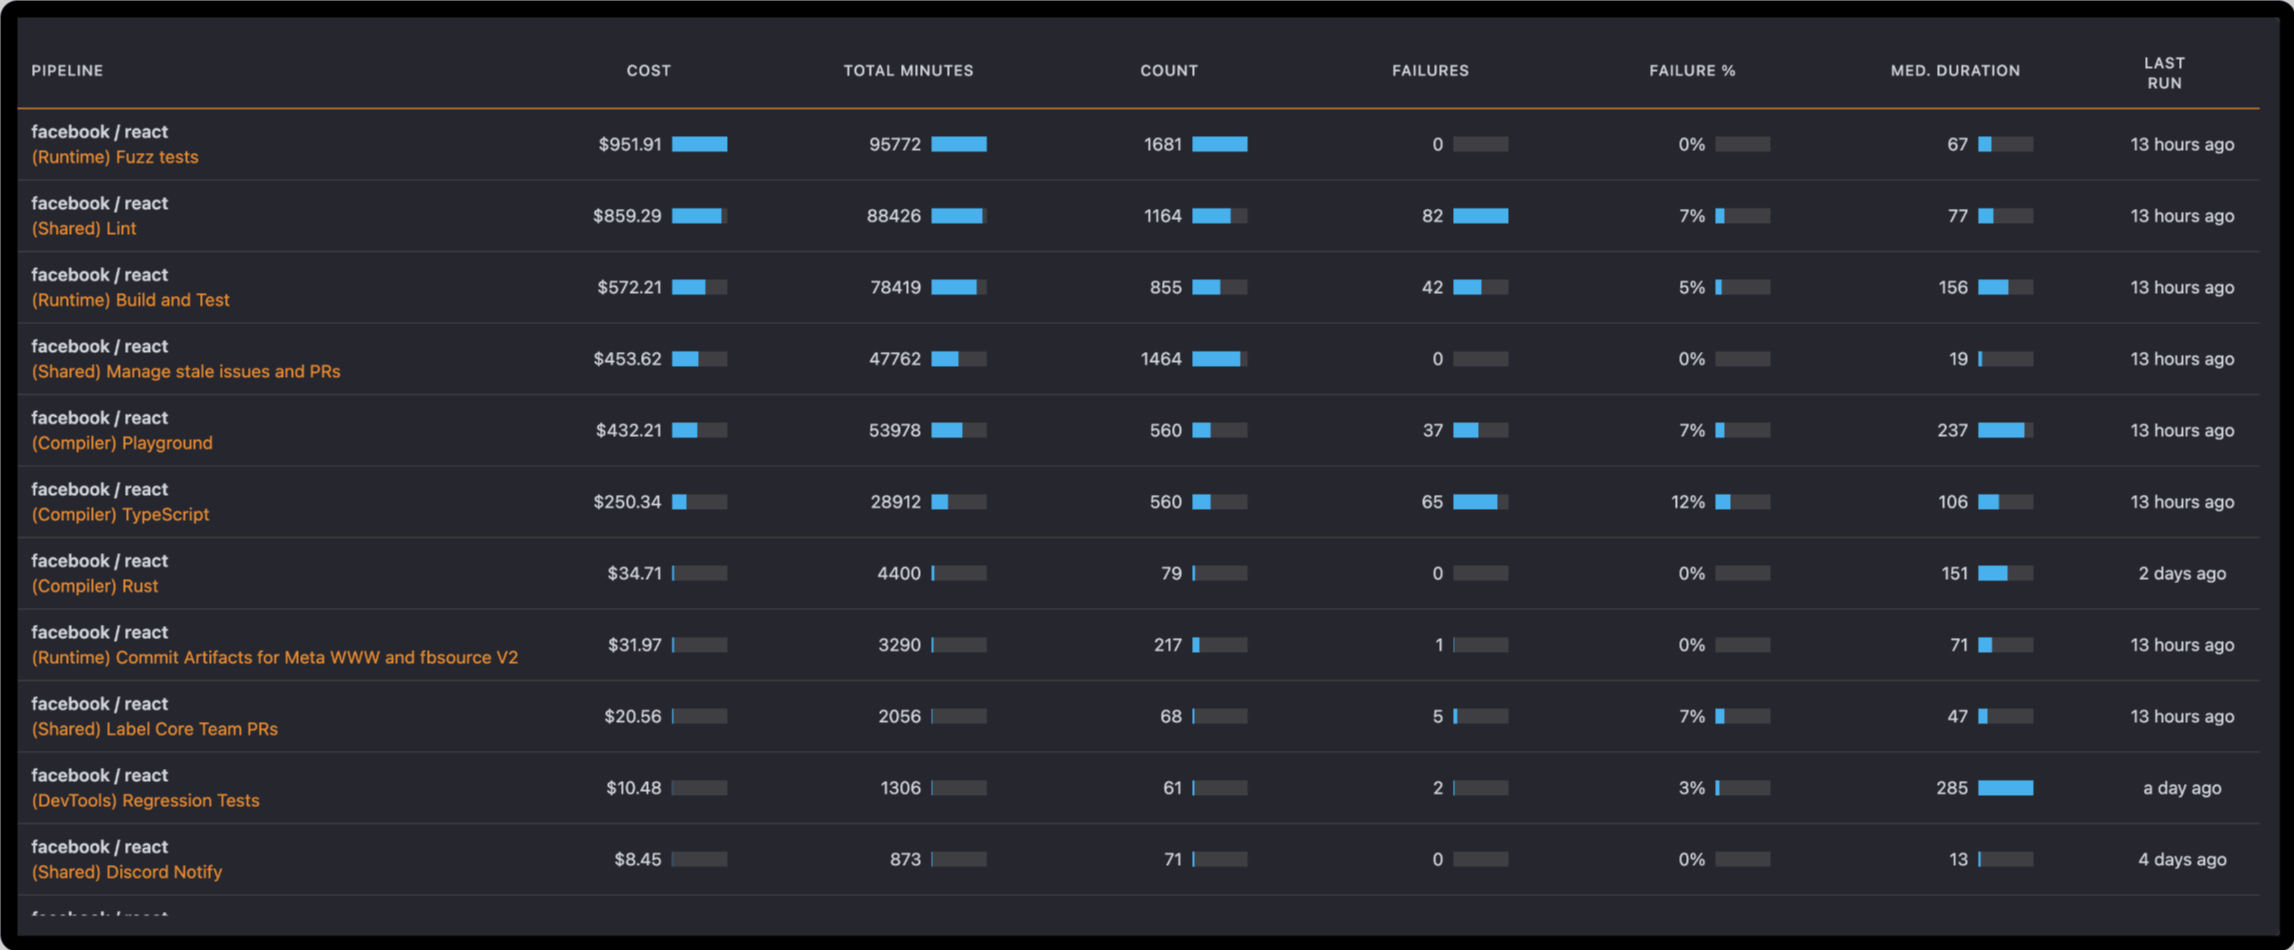
The Pipeline Cost Table presents an itemized usage of resources and the costs accrued for each pipeline in a project. This would enable DevOps teams to identify those pipelines that cost a lot regarding resources, spot inefficiencies, and optimize their spending on CI/CD.

| Column | Description | How It Helps |
|---|---|---|
| Pipeline | The name of the pipeline and the repository it represents | Helps identify and distinguish pipelines at a glance |
| Cost | The total cost incurred by the pipeline for the selected time period | Immediately identify the most costly pipelines for optimization |
| Total Minutes | Total execution time of all runs in this pipeline | Understand resource usage and compare across pipelines |
| Count | Total number of executions for the pipeline | Identify high-frequency triggers or repetitive rebuilds |
| Failures | The absolute number of failed executions for the pipeline | Find pipelines with recurring failures |
| Failure % | The percent of executions that failed in total | Identify pipelines with high failure rates for debugging |
| Median Duration | Median runtime for each run of the pipeline | Compare typical run times to identify slower pipelines |
| Last Run | Displays when the pipeline was last executed | Track activity recency and execution patterns |
Cost Analysis
Focus on the most expensive pipelines to find opportunities for optimization, such as caching or reduction of runs that are not necessary.
Failure Analysis
Pipelines with a high failure percentage should be prioritized for debugging to maintain CI stability.
Performance Optimization
Identify pipelines with a high median duration or total runtime and optimize caching, parallelize, or simplify the complexity.
Usage Patterns
The frequency in the count, such as high counts of executions, pipelines with high expenses could indicate either overuse or inefficiencies in trigger settings.
Why This Page Matters
The Cost Page helps you manage your CI/CD budget:
- Resource Usage Optimization: Highlight inefficient workflows or resource-heavy pipelines
- Monitor Cost Trends: Understand spending patterns for budget planning and improvements
- Leverage Free Usage: Maximize free minutes and avoid unnecessary costs