CubeScore™
In CICube, we built the CubeScore™️ system to automatically help DevOps teams track their GitHub Actions CI pipelines, and surface opportunities for optimization. It's sort of like an Elite Status indicator, if you will—CubeScore™️ gives a sense of how our overall CI process is doing, focusing only on Continuous Integration (CI) rather than wider delivery metrics such as DORA.
CubeScore™️ is a way to measure how our CI pipelines run based on real data, straight from how our workflows are running against industry benchmarks. The idea here is to bring us across those elite levels so that we can keep things running smoothly and at that consistent high quality of software delivery.
The score is computed based on the actual data points from the CI of development teams benchmarked against industry benchmarks on four North Star Metrics:
- Duration of Workflow Runs: How long it takes for a pipeline to finish. Elite teams keep this short to speed up delivery.
- Success Rate: How many successful pipeline runs happen onto the default branch. Fewer failures meaning less idle downtime are a result of a high success rate.
- Throughput: The number of pipeline runs a team finishes every specified period. High throughput shows that more work is being done in less time.
- MTTR (Mean Time to Recovery): The Mean Time to Recovery after a pipeline goes down due to failure. Elite teams recover fast to lessen the impact.
By monitoring and improving these North Star metrics, we'll know when our CI processes are getting better, that we're recovering faster, and that overall performance is improving. CICube helps you understand how your team's performing against these metrics, provides insight, and even recommendations on how to reach Elite Status.
What CubeScore™️ charts shows?

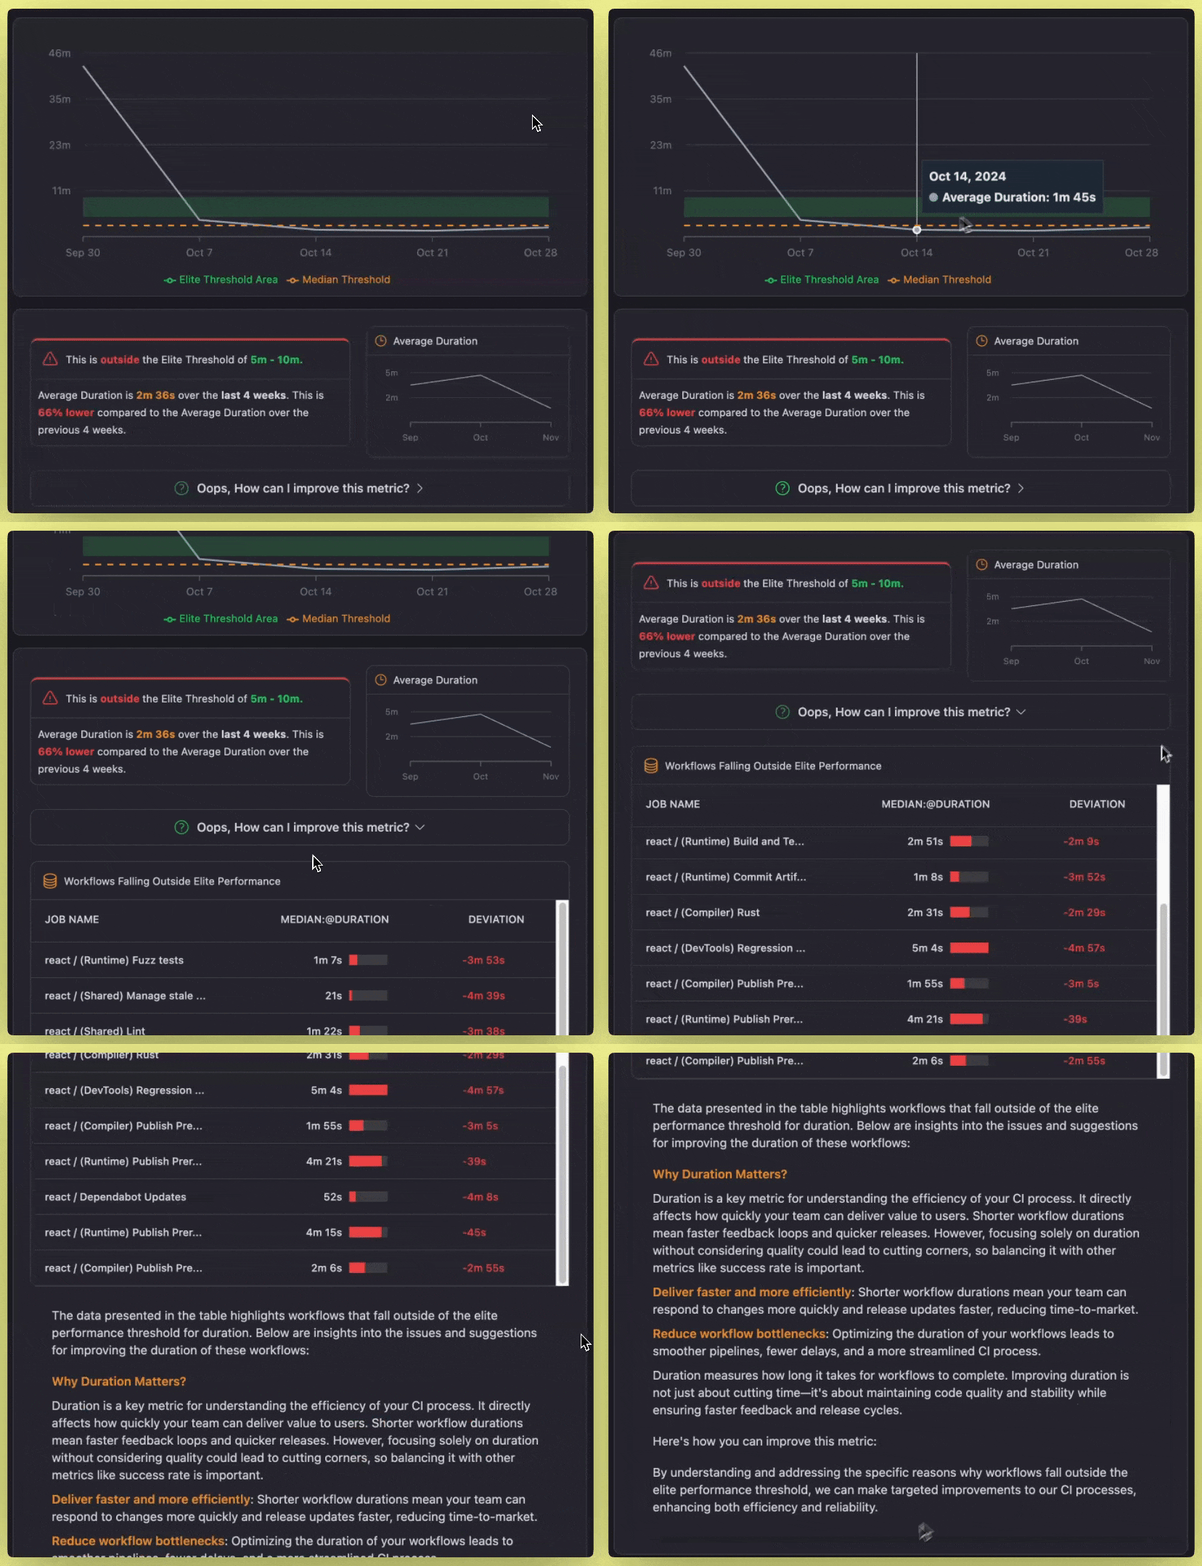
- Main Chart: Charts the trend of a chosen metric over selected periods. It includes Elite and Median thresholds for comparison at its base.
- Status Alert: This will indicate whether your metric falls inside the Elite range, and will also show recent performance bars.
- Average Mini-Chart: Quick view of metric trends in weeks.
- Optimization & Suggestions: Provides AI-powered actionable suggestions for improving the metric and enumerates any workflows that are preventing you from achieving elite performance in tabular form.
What does Elite mean in DevOps?

In DevOps, Elite software delivery teams consistently deliver quality software at speed, with minimal failures and rapid recovery times.
Elite Status and Elite Benchmarks
Became an elite team means hitting or topping certain benchmarks for key metrics. These benchmarks help us gauge our standing as compared to the benchmark set by the industry.
-
Elite Benchmarks: The elite teams perform well in the four key metrics that we mentioned. For instance, they have a success rate of more than 90% on the default branch, recover from failures (MTTR) in less than 60 minutes, maintain pipeline duration of less than 10 minutes, and ensure high throughput by running multiple workflows smoothly each day.
-
Sector Median Performance: This median tells about the performance of an average team for you to compare your metrics with the industry standard. If your MTTR, for example, is more extended than the median, then that might be an indication of the need to work on your recovery strategies.
Now let's look at those metrics and their benchmarks.
Deep dive in to North Star Metrics and their benchmarks
We have set up these four North Star metrics, coupled with crystal clear charts and visuals in CICube, to show complete visibility on the health of a team's CI pipeline.
For this, we will use our live demo, which has the React.js GitHub repository workflows, and it will show live exactly how CubeScore™️ works and how it helps teams achieve elite performance.
Duration
Elite Benchmark: 5-10 Minutes
Sector Median performance: 2.5 Minutes
Duration tracks how long it takes for a CI pipeline to run from start to finish. Faster feedback on code changes means faster product development.
Duration refers to how long a CI pipeline takes from start to finish. The faster the feedback on code changes, the faster the product development.
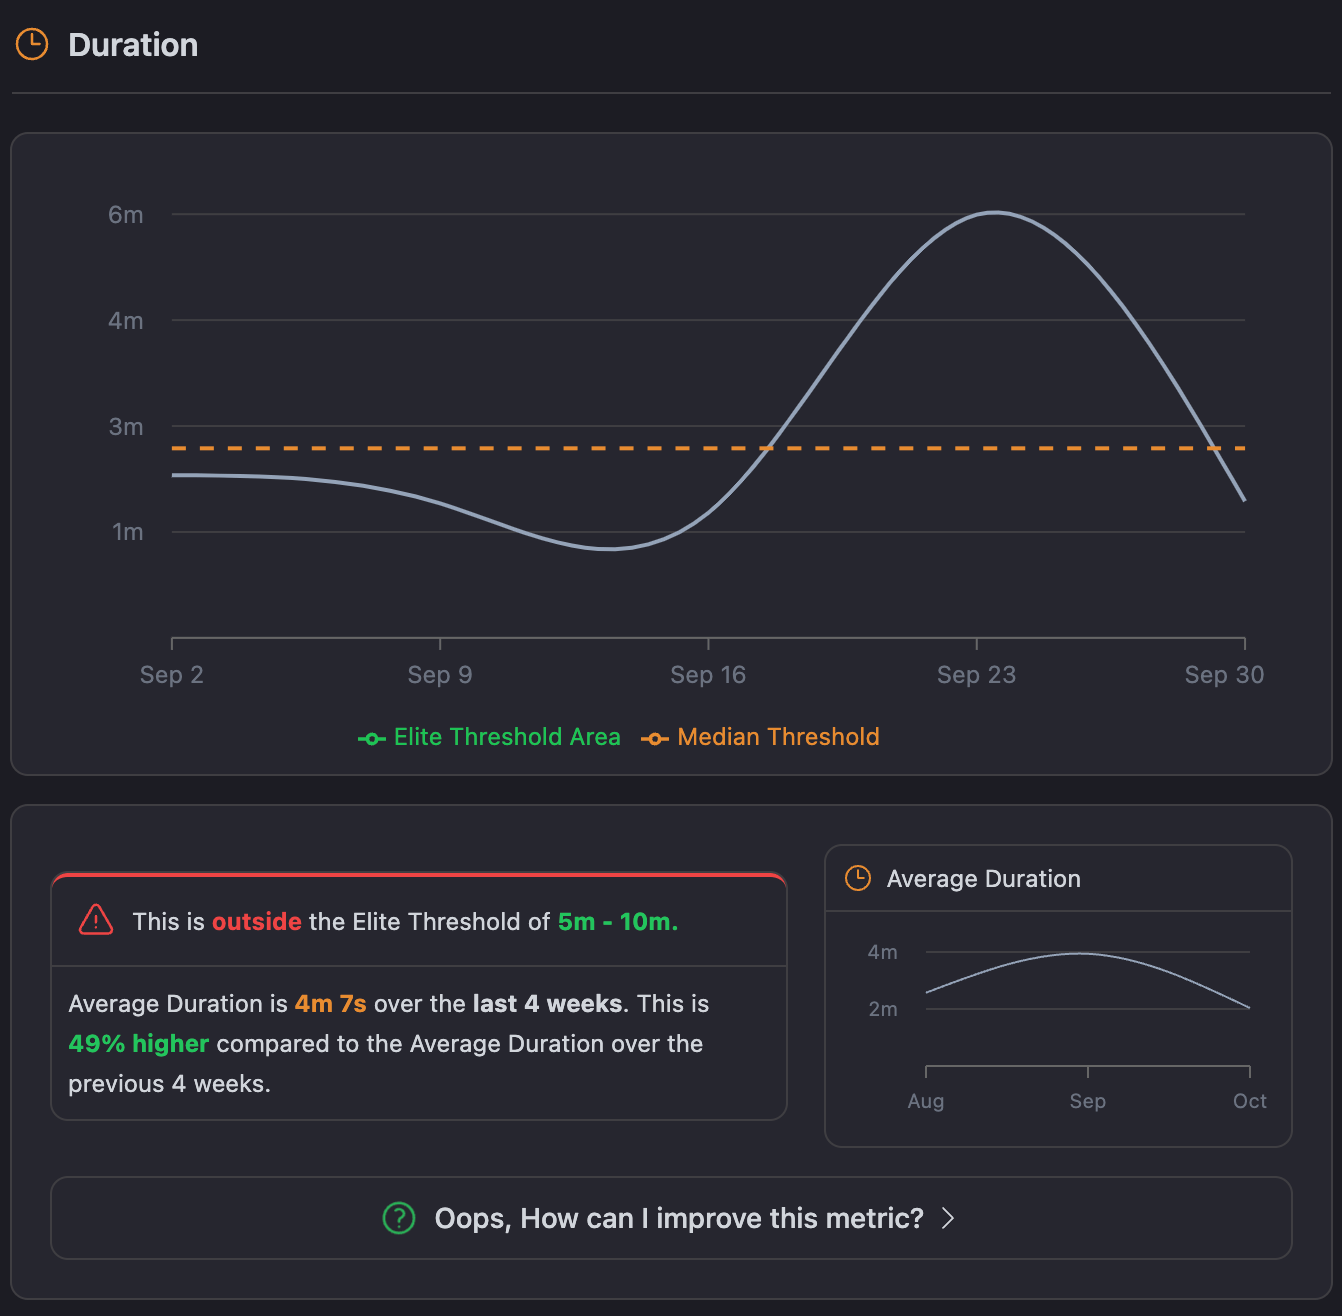
The elite benchmark for Duration is 5-10 minutes, while the median is at about 2.5 minutes. While it would seem intuitive that shorter is always better, elite teams tend to have longer pipelines since they have more thorough tests, security scans, and quality checks that catch problems before they happen.
While it would seem intuitive that shorter is always better, elite teams tend to have longer pipelines since they have more thorough tests, security scans, and quality checks that catch problems before they happen.

The chart is showing your pipeline's average duration over time, compared to the Elite and Median thresholds. For example, when your time is around 4 minutes, it means you are on a good track. However, that may not be that far regarding optimization.
What’s the Ideal Duration?
The duration times are near about 10 minutes. This threshold gives very good insight into how things are going without increasing development time.
Keep early-stage optimizations such as linting, unit tests, and static security checks, but you can do the end-to-end or performance tests at a later stage. This also can be done with the help of tools like parallelization and caching that allow us to make pipelines faster without sacrificing quality.
This also can be done with the help of tools like parallelization and caching that allow us to make pipelines faster without sacrificing quality.
Balancing speed and quality in CI pipelines
While devs usually want speed, platform engineers play an important role in making sure we don't sacrifice quality. They're helping set up the right guardrails so the pipeline includes the tests that should run but aren't longer than they need to be. What one would intend to achieve is a balance providing feedback that's fast enough to keep the momentum going yet detailed enough to catch potential issues early without bypassing major quality checks.
In this case, when balanced, the best of both worlds would have been achieved: fast development cycles and quality software that meets functional and non-functional needs.
Balancing Speed and Quality
Developers often push for speed, but that is what a platform engineer has to balance. Yes, feedback can be fast, but only if it skips essential checks. Finding this balance leads to fast development cycles and high-quality software.
Success Rate
Elite Benchmark: 90% or higher on the default branch
Sector Median Performance: 83% on the default branch
Success Rate can be regarded as one of the key North Star Metrics, showing how well our CI works. This metric will indicate the percentage of successful pipeline runs over a given period and will prove indicative of the stability of our pipelines and the general quality of our code. The better the success rate, the more reliable the pipelines, meaning smoother and more predictable releases.
The elite benchmark for the success rate is 90% or higher on the default branch, while the average rate across the industry is around 83%. That 90% isn't just about reducing errors; it's about keeping the main branch stable enough to confidently deploy into production.

The Success Rate chart gives us an easy way to look at how stable our pipelines are over time. It provides the success rate in terms of percentage—so we immediately get a sense of the pipeline's reliability. For instance, averaging out to 93% over this last 4-week period is above the elite benchmark of 90% and up by 8% from the preceding period.
This improvement means fewer pipeline failures, resulting in a more stable codebasea and also allows us to see how we compare to Elite and Median benchmarks, making it easier to identify areas for improvement.
Why does success rate matter?
A high success rate reduces wasted time on broken pipelines and enables faster, higher-quality releases. However, occasional failures can provide valuable insights, catching bugs or security issues early.
For instance, when using test-driven development or a fail-fast approach, our success rate may dip temporarily, yet this ultimately strengthens code quality. It’s not solely about avoiding failures—it’s about learning efficiently from them.
What’s the ideal success rate for CI pipelines?
To keep our pipelines stable, aiming for a success rate of 90% or higher on the default branch ensures the mainline is always production-ready. Topic branches can have a lower rate since they test new features, but keeping the main branch stable is key.
Meeting this benchmark reduces downtime, enables more frequent releases, and enhances code quality.
Success rate isn’t everything: What else should we look at?
A 100% success rate might appear ideal, but it doesn't provide the full picture. A pipeline could pass all tests and still deliver value inefficiently or slowly.
Metrics like MTTR (Mean Time to Recovery) offer critical insights. For example, recovery speed from failures often says more about pipeline health than success rate alone.
Here are some practical tips for improvement:
- Focus on recovery times: Small, frequent commits and smarter testing practices shorten recovery times, improving both success rates and reducing failures over time.
- Set realistic baselines: Don’t expect perfection initially. Establish clear success targets for each branch or project and aim for steady improvement.
- Look for patterns: Drops in success rates may not only stem from code issues. Recognizing patterns, such as spikes during busy times, can reveal non-technical factors affecting team performance.
A team that can recover quickly from failures often performs better than one that avoids failures but takes longer to resolve issues when they arise.
Mean Time to Recovery (MTTR)
Elite Benchmark: 60 Minutes
Sector Median Performance: 58 Minutes
MTTR measures how quickly we can recover when a pipeline fails. Failures in CI pipelines are unavoidable, whether due to failed tests or build errors. What truly matters is how quickly we can identify and resolve these issues, minimizing downtime and keeping code flowing smoothly.

Looking at the chart, the average MTTR over the past 4 weeks has been 9 hours and 9 minutes. That's significantly longer than the Elite Benchmark of 1 hour, indicating room for improvement in issue resolution speed. The chart also shows an upward trend, suggesting that recovery times are increasing rather than decreasing.
Why MTTR matters?
A lower MTTR enables us to recover from failures faster, ensuring pipelines continue without major delays. It’s not solely about speed—quicker recovery gives developers more time to focus on building features instead of fixing broken builds. Efficient recovery keeps issues under control, helping everything run smoothly.
How to improve MTTR?
- Faster Feedback Loops: Reduce pipeline durations to detect and resolve issues sooner.
- Proactive Monitoring: Establish real-time notifications on failed builds, so the team can take immediate action.
- Smaller Commits: Aim for smaller, more frequent commits, which make it easier to identify issues
- Detailed Error Reporting: Ensure error messages provide enough context for quick problem identification and resolution.
Throughput
Elite Benchmark: Varies based on project needs
Sector Median Performance: 1.68 times per Day
Throughput measures the number of pipeline runs completed in a day, reflecting CI efficiency. More workflows completed means faster delivery of value and more frequent iteration on products.
For elite teams, high throughput reflects a balanced, efficient process, handling a significant volume of work without compromising on quality or stability. While there isn’t a single benchmark for throughput, aligning it with business needs is key—whether that means delivering many small updates daily or fewer, larger workflows.
For example, in a mission-critical application, running workflows frequently helps maintain stability in the face of constant change. Conversely, for a less time-sensitive project, the focus might shift to thorough testing and quality, even if it means fewer runs.

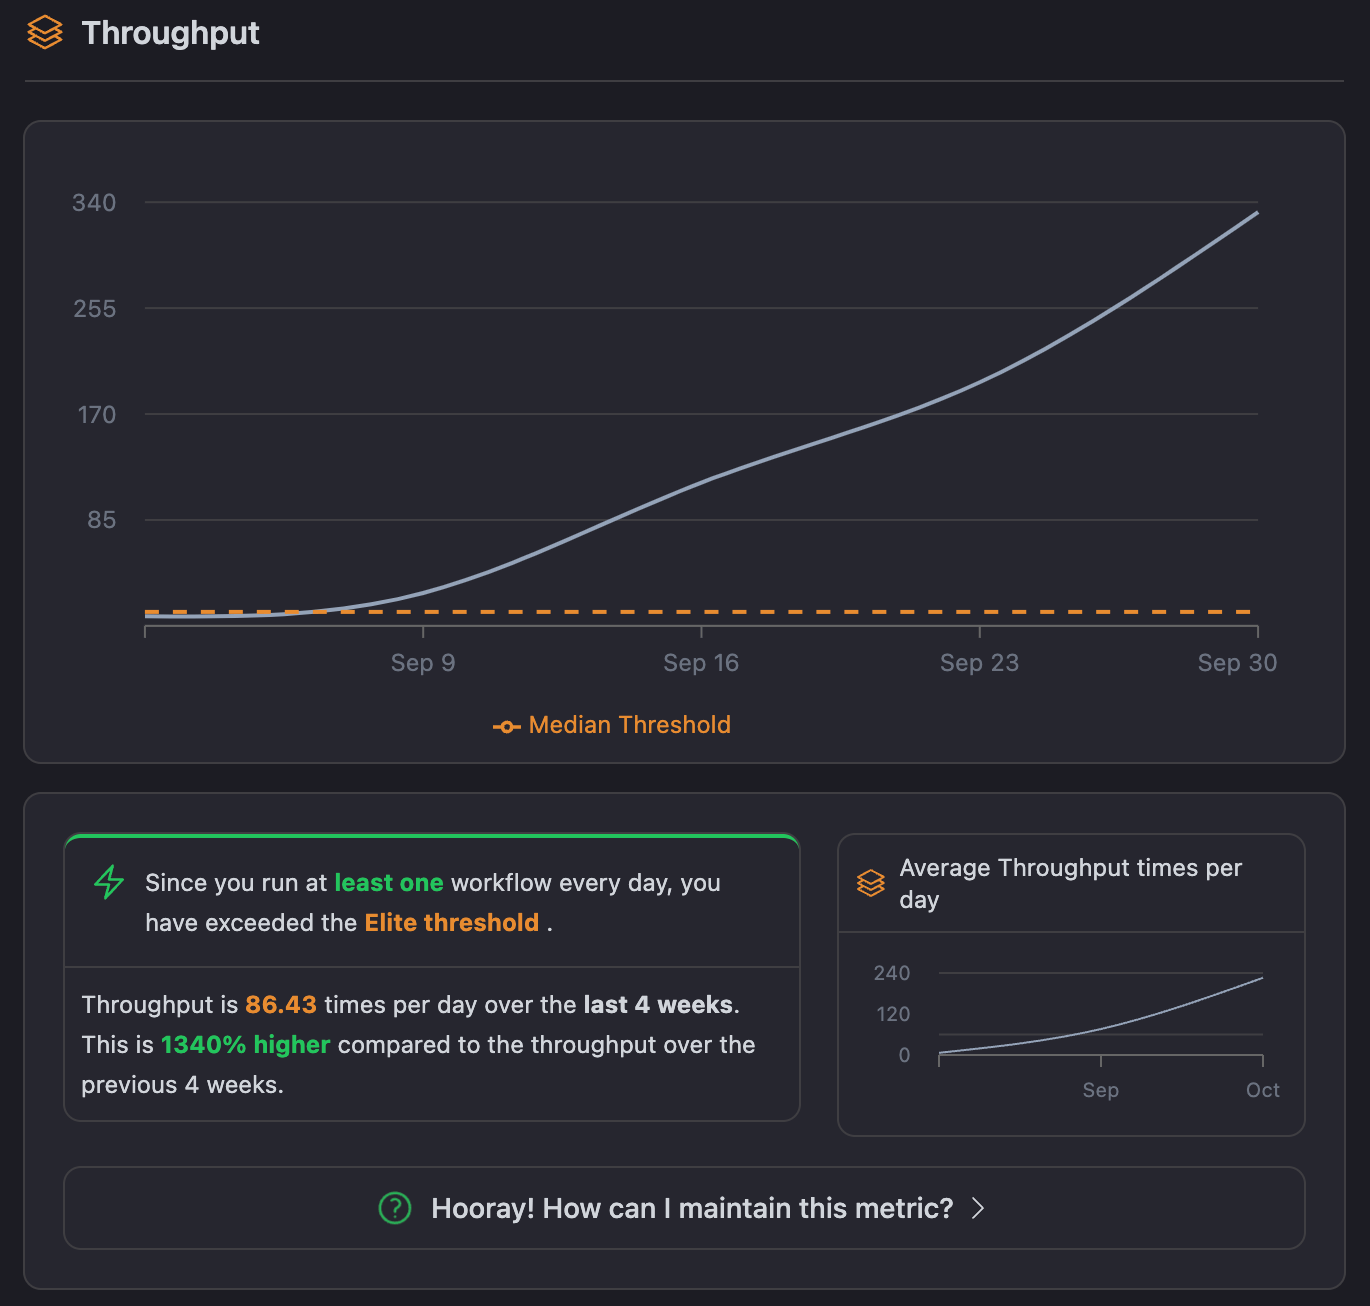
Like above, we can trend our throughput over time and benchmark against the median and elite benchmarks. For example, the sector median throughput is approximately 1.68 workflows per day. What this means is that a team is steadily processing work through the CI pipeline. Elite teams would have an even higher value, especially because they have automated more and may have streamlined processes.
What’s the Ideal Throughput?
There is no specific target for throughput; this truly depends on what your project and team require. The aim is to reach a balance whereby throughput reflects both productivity and quality. Bear in mind that greater throughput does not necessarily translate to better performance.
Sometimes, in an effort to boost numbers, teams might push out work that is poorly tested, which can lead to issues down the line. That's why it's equally important to give due weight to both the quantity and quality of workflows in the pipeline to ensure reliable, dependable results.