Failed Pipelines Charts
Bar Chart
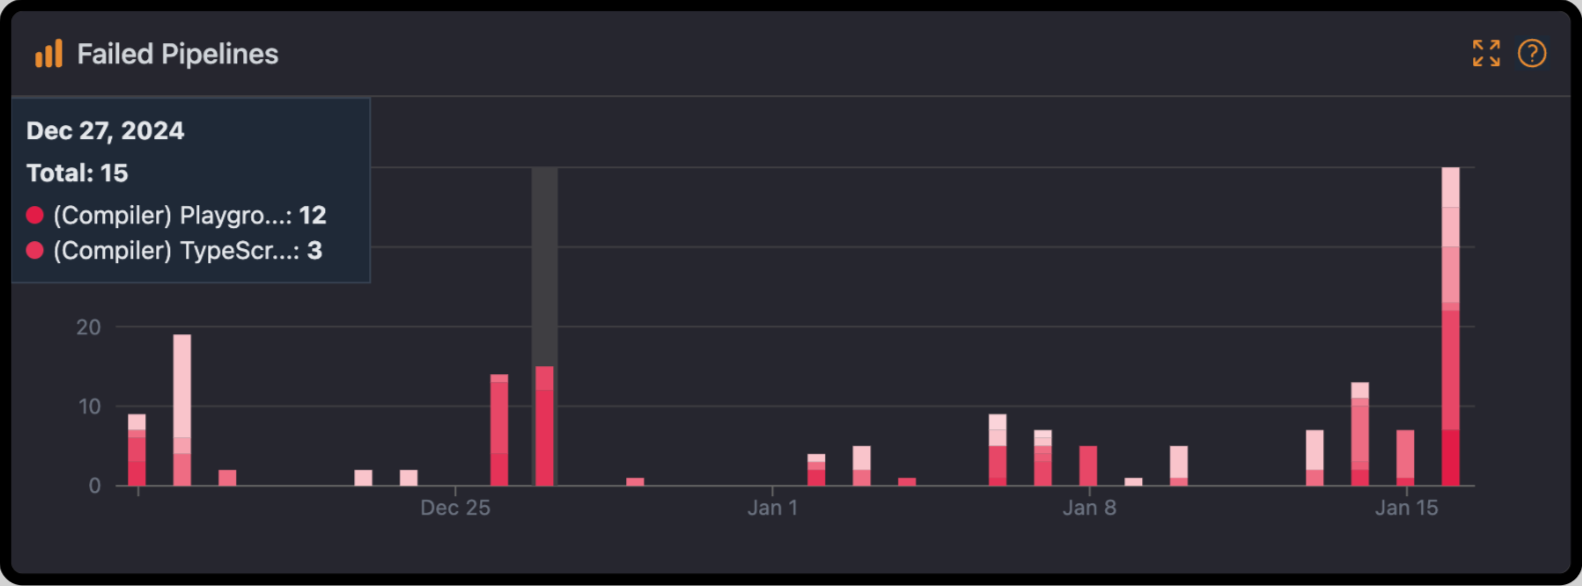
This chart visualizes pipeline failures by day over the past 30 days. Hover over a bar to see details on the total number of failures for that day and how many were coming from each workflow.
How This Helps Your DevOps Process?
- Problematic Workflow Identification: Identify instantly which workflows are leading contributors to pipeline failure.
- Track Trends: Analyze patterns in failure for avoiding recurring failures.
- Enable Proactive Fixes: Make failing jobs top of the queue to help drive teams more productive.
Use Cases
- Daily Standups: Review pipeline failures that happened the previous day, and assign debugging to owners.
- Sprint Retrospectives: Discussion about the impact of failures regarding sprint goals, discussion of opportunities for improvements.
- Resource Planning: Identify the workflows that result in frequent failures to optimize team and infrastructure resources.
Accumulated Duration Chart
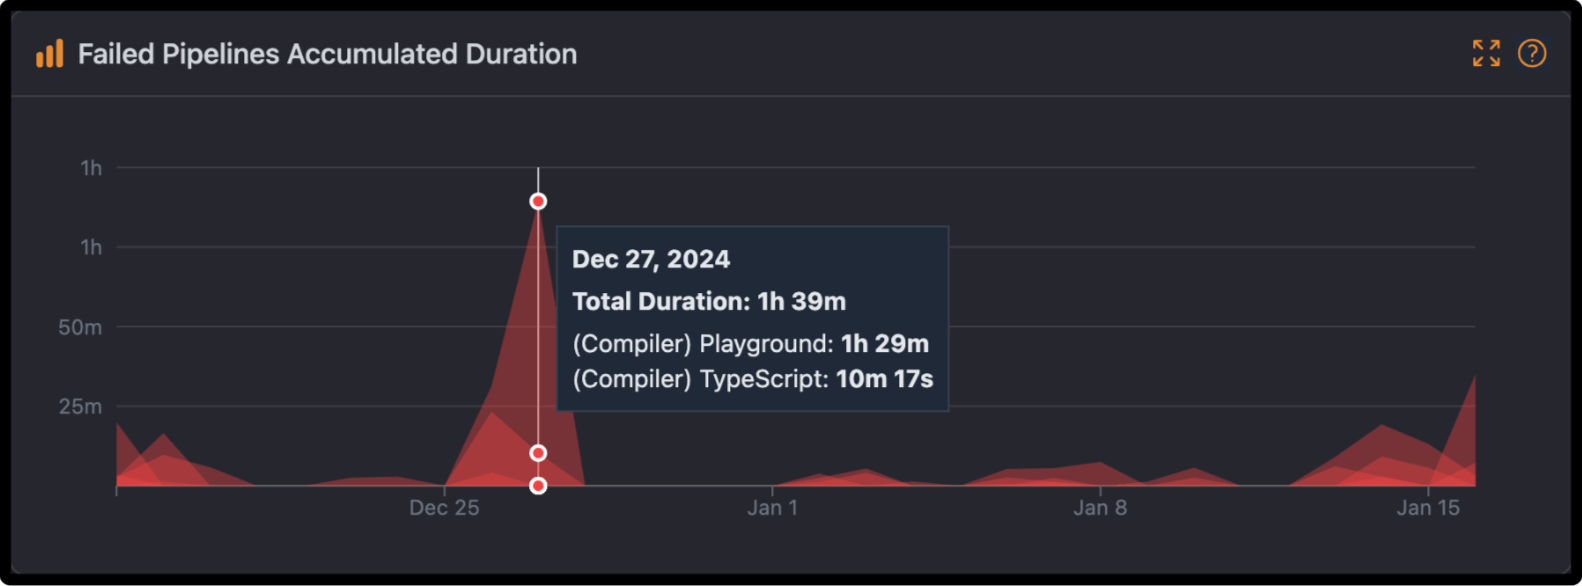
The Accumulated Duration Chart plots the overall wasted time for failed pipelines on a 30-day timeline. Each colored layer in this area stack chart represents a share taken by different workflows in the total duration contributing to failures.
How This Helps Your DevOps Process?
- Quantify Impact: Visualize the time cost of pipeline failures to get a sense of productivity loss.
- Bottleneck Detection: It pinpoints workflows that have the highest failure duration for targeted optimization.
- Efficiency: The data should be used to reduce lost time and further optimize resources.
Use Cases
- Cost Analysis: This shows the financial impact of pipeline downtimes.
- MTTR Optimization: Leverage failure duration trends in MTTR improvement.
- Capacity Planning: Using the data to create an efficient runner and node allocation.
How These Charts Work Together
These charts are complementary in providing a quantitative view-which counts of failure provide-and a time-based impact view, failure duration, on the health of the CI pipeline. Combined, they will enable DevOps teams to:
- Diagnose Issues Faster: Identify high-priority workflows and failures.
- Plan Proactively: Apply trends to prevent repetitive failures for the improvement of reliability.
- Optimization of Resources: Pay more attention to very impactful workflows that reduce time and financial wastage.
Tips for Daily Use
- Integration: Configure notifications for failure count spikes or duration spikes over Slack & Teams.
- Team Alignment: This is to be used with the charts during daily stand-ups or even in a week's retrospectives to go over pipeline health.
- Continuous Improvement: Perform analysis on flaky tests, job optimization for parallel, and improvement on the caching strategy by drawing insights from the charts.