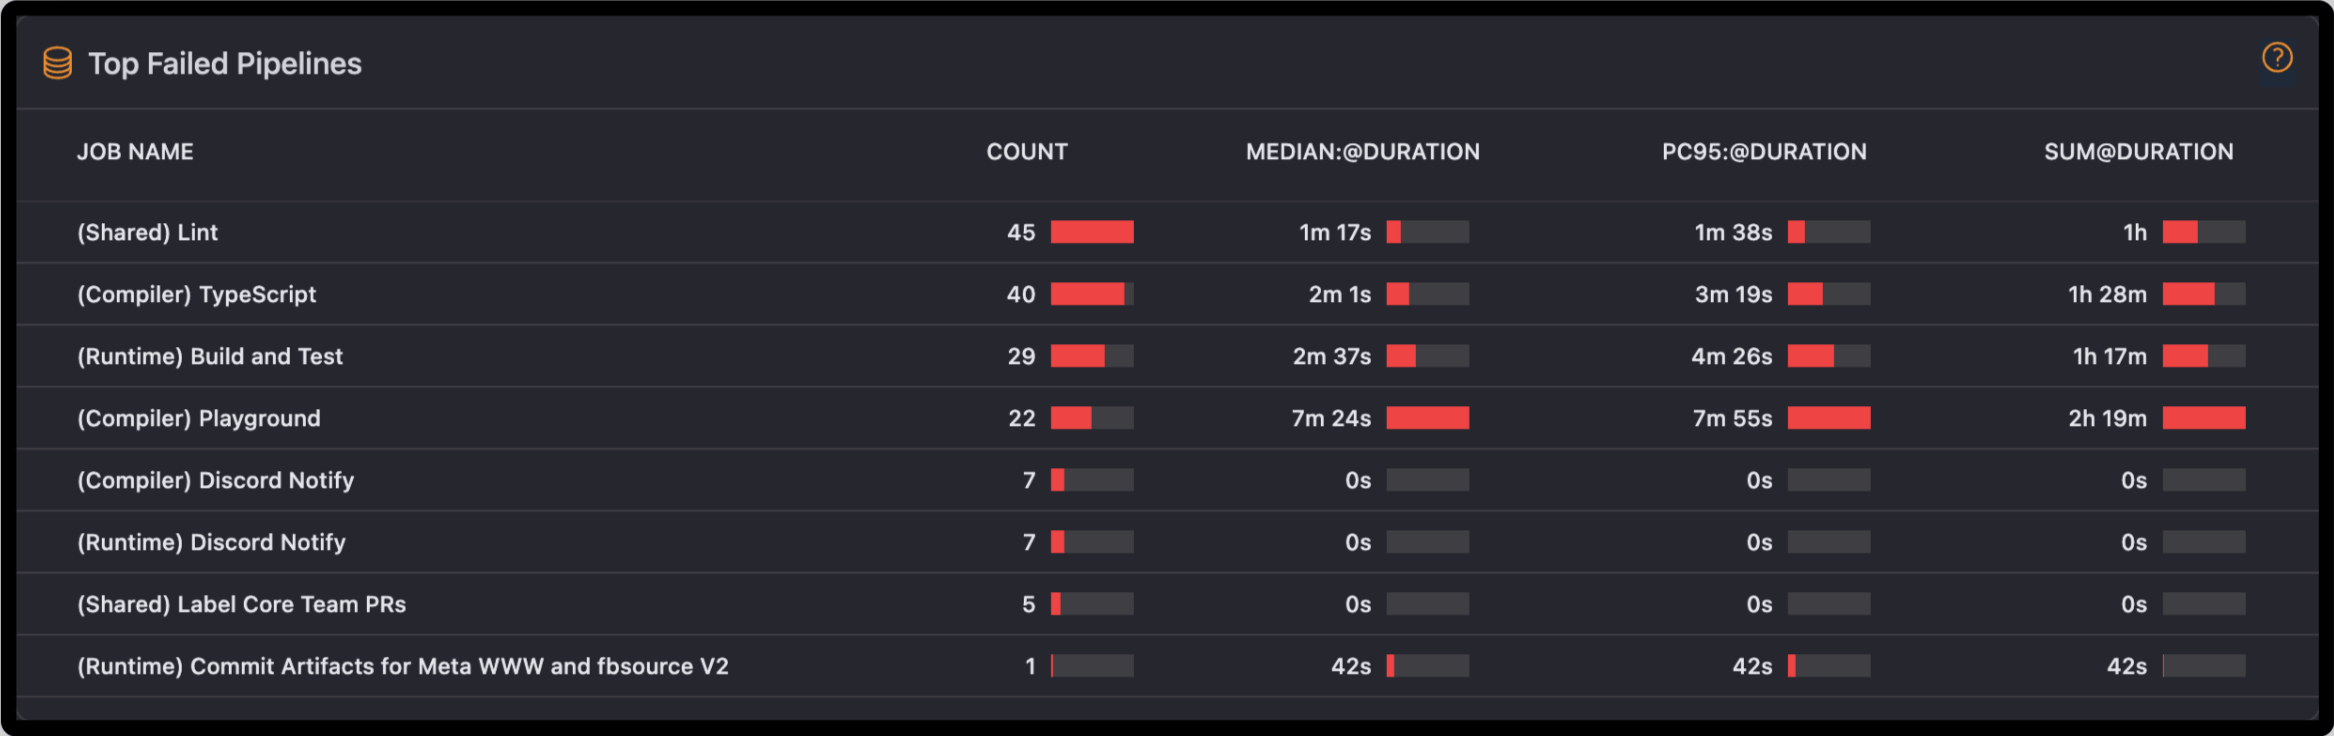
Top Failed Pipelines Table
The Top Failed Pipelines chart provides an instant overview to the DevOps teams about which pipelines in their workflow are most faulty.
From failure count to median duration, 95th percentile duration, and total duration, the chart shows key points based on which the team can optimize the pipelines to make them more effective.
Key Metrics
Failure Count
The Failure Count metric indicates the number of times each pipeline failed in a given period.
Frequent failures can indicate systemic issues of a pipeline, such as flakiness in tests, misconfiguration, or resource constraints. Tracking the number of failures ensures that teams can identify recurring issues much earlier and limit potential impact.
You can analyze failing pipelines to determine possible common causes and prioritize debugging efforts by focusing on the most frequently failing pipelines. This allows you to use resources more efficiently and resolve issues more quickly.
Median Duration
Median duration is the middle value of all the durations of failed pipelines, providing an average sense of how long failures take to resolve.
Long median durations may indicate bottlenecks or inefficiencies in delaying the resolution times, impacting the overall velocity of the CI/CD pipeline and making teams less productive.
How to Use It: The comparison of median duration between pipelines helps understand which workflows are less efficient. Additionally, you can focus efforts on pipelines that have longer median duration to reduce delays and allocate resources effectively.
95th Percentile Duration
95th Percentile Duration represents the longest 5% of pipeline runs which failed, providing insight into near-worst-case performance but excluding extreme outliers.
It is one of the most important metrics in DevOps, as it helps in finding and fixing high-impact, longer-duration runs that may not appear in average duration analyses.
Example 95th Percentile Duration
If your pipeline durations (in minutes) are: 1, 2, 2, 3, 3, 4, 5, 6, 8, 30.
- Average duration is 6.4 minutes, skewed by the outlier of 30 minutes.
- The 95th Percentile Duration is 8 minutes, ignoring extreme anomalies and focusing on actionable delays.
How DevOps teams can use it?
The 95th Percentile Duration narrows down to only the longest-running 5% of those failed pipeline runs, which will normally introduce great delays and hence disturb the performance of the whole. By identifying such high-impact runs, teams should be able to know that further workflows will be smoother and bottlenecks may be avoided in advance.
Optimizing Resources
If some pipelines or jobs always reach the 95th percentile, that is a sure sign that something is wrong and needs maintenance. Using such information, teams can optimize such pipelines by caching and parallelization, among other techniques, which will serve to utilize resources better and keep the CI/CD processes efficient.
Tracking Improvements Over Time
The 95th percentile duration helps to provide an insight into the effectiveness of your optimizations. This exposes long-term trends that might otherwise be hidden and could indicate flakiness in tests, resource problems, or bottlenecks-so teams can spot these quicker. Keeping track of this metric keeps your pipelines in order.
Staying Proactive
This metric will help the team focus on which pipelines are causing the most delay. Early fixing of these issues prevents them from turning into bigger problems. It's proactive, so you can rest assured your pipelines will meet performance expectations without any firefighting at the last minute.
Setting Alerts for Faster Response
Teams can set thresholds for what is acceptable and utilize alerts to make sure they know when the pipelines exceed those limits. Issues in that way will be flagged immediately for the teams to act upon and not allow them to grow bigger.
Performance Comparison on Pipelines
The 95th percentile duration also makes it easy to compare workflows. By seeing which pipelines are consistently slower, teams can prioritize which one needs improvements first and will save them a lot of time and effort.
Faster Deployments
Fixes to high-duration pipelines shorten the feedback loop, thus enabling teams to deploy faster. With faster pipelines, delivery cycles are shorter, productivity is higher, and delays in the development process fewer.
Ensuring SLA Compliance
By addressing longest pipeline duration, teams can come within targets of SLAs. Thus, it allows pipelines to be reliable to work under strain and meet standards, keeping them happy along with stakeholders' satisfaction.
Total Duration
Total duration aggregates the time spent in total on pipeline runs failing.
This metric gives a total view of how much time is lost to failure. Long total durations have quite an impact on delivery schedules and increase costs greatly because of the waste of resources.
How to Use It: This metric can be used for budgeting and planning by helping to quantify time and cost impacts of pipeline failures for resource allocation. Additionally, reduction targets should be set for the total failure duration to improve overall efficiency.