Pipelines Detail
The Pipeline Details section gives you an in-depth view into your CI pipelines. This is where you can track the trends in executions, spot inefficiencies, and work on optimizing the pipelines. The functionality is split into two major views:
Pipelines Table: A high-level summary table of all pipelines.
Pipeline Insights: Detailed view of a selected pipeline.
Pipelines Table
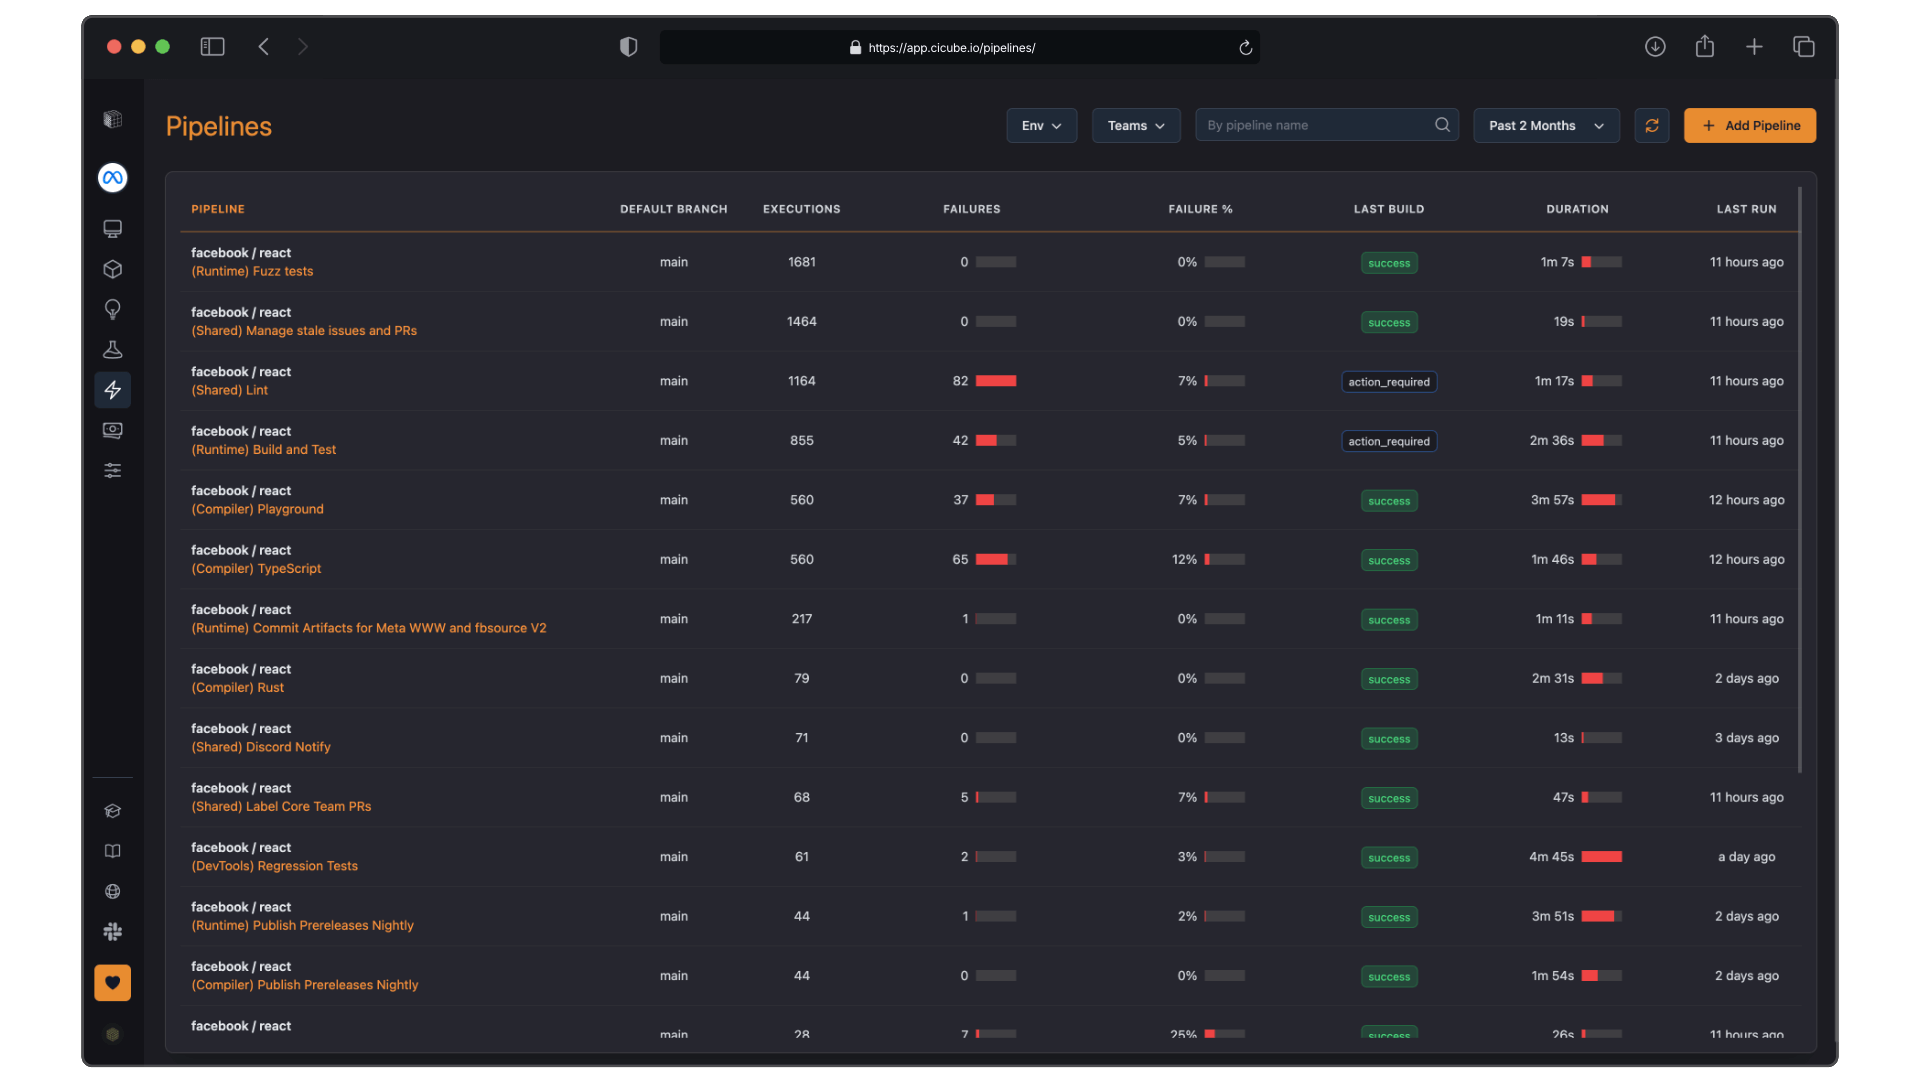
The following table gives a quick overview of all pipelines concerning your project. It displays the following metrics and information:
Pipeline Name: This will enlist the name of each pipeline and its associated branch.
Executions: The number of executions that have occurred for each pipeline in the selected time range.
Failures: Number of times each pipeline has failed.
Failure %: The percentage of executions that failed out of the total executions.
Last Build: Displays the result of last build, for example, passed or action required.
Duration: Average execution time of the pipeline.
Last Run: How long ago, in relative terms, the last execution occurred.
Pipeline Insights (Detailed View)
The Pipeline Insights page opens when a pipeline is selected from the table, showing granular details for that selected pipeline. This page is divided into several sections:
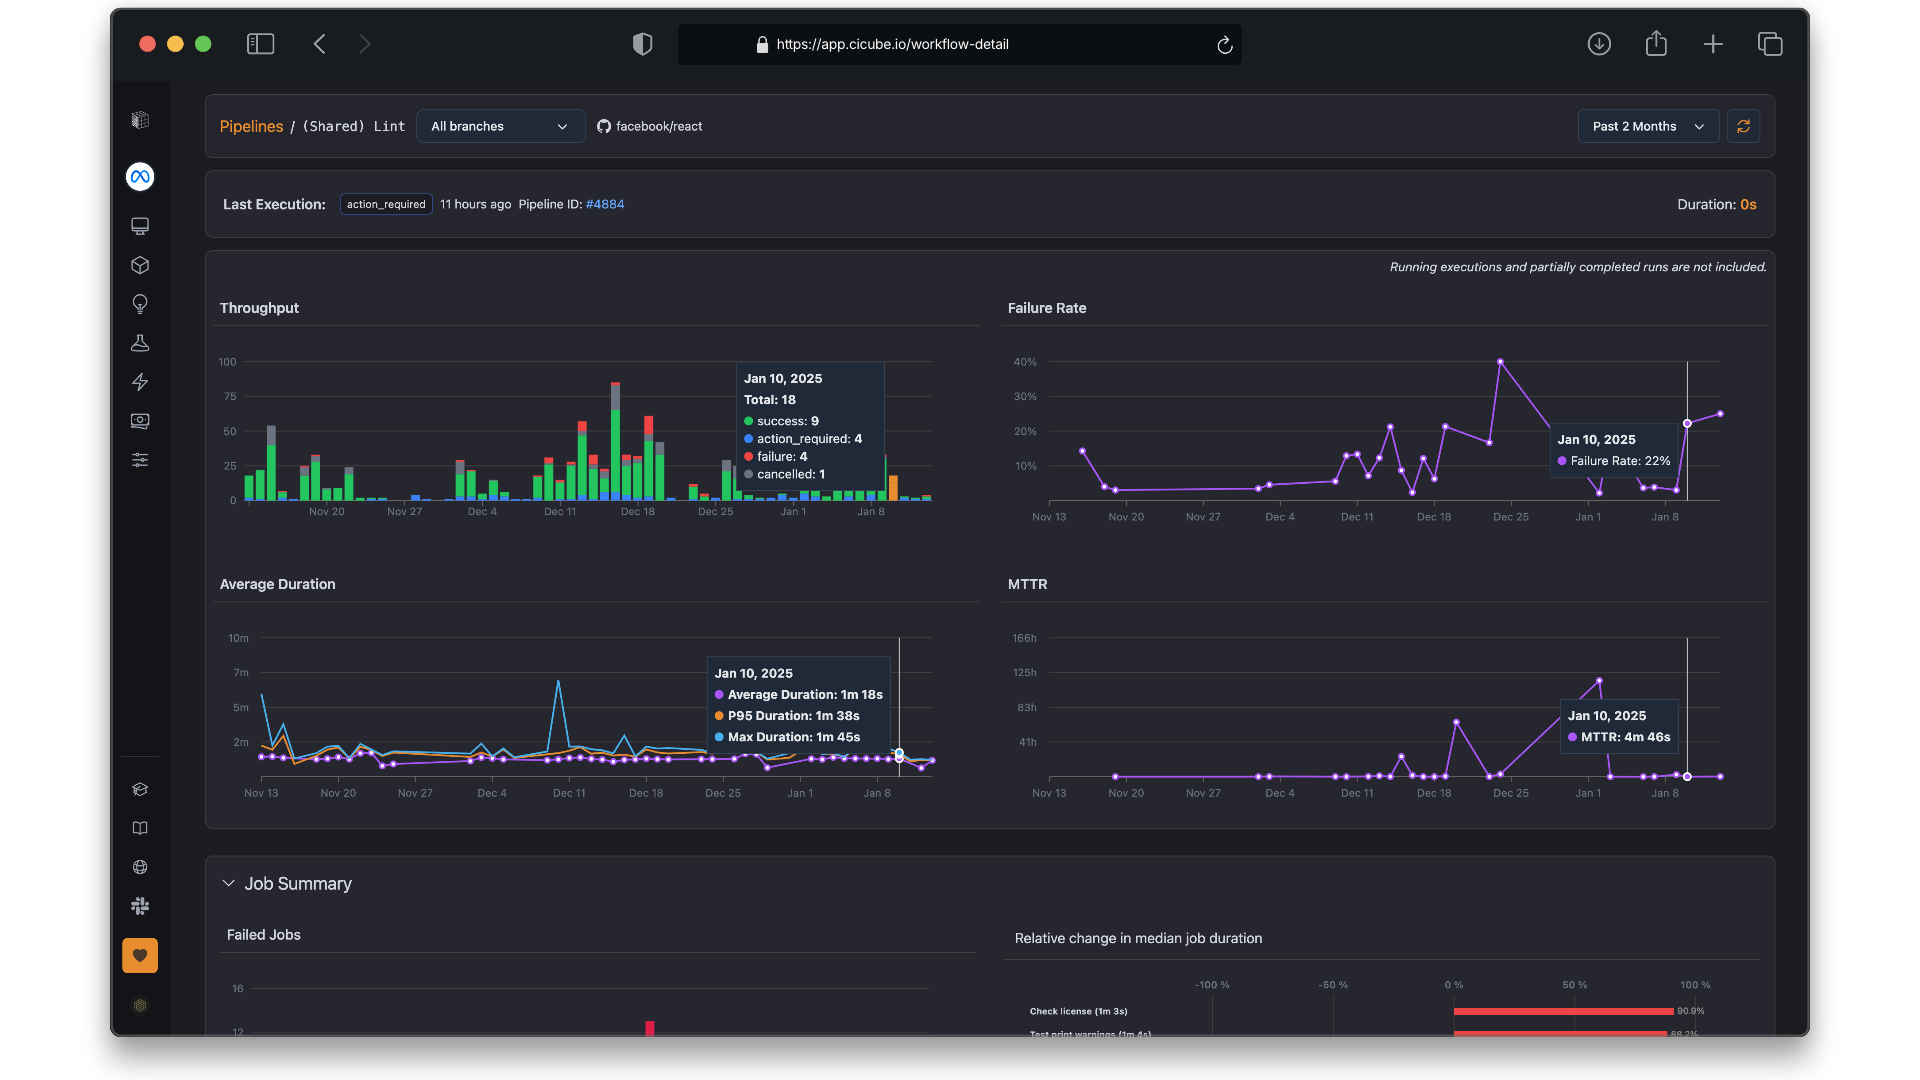
Execution Trends
Shows an aggregated view of throughput, failure rate, average duration, and MTTR - Mean Time to Recovery.
How Execution Trends Charts benefit the DevOps teams
This presents four important metrics-Throughput, Failure Rates, Average Duration, MTTR-all on a single view. Each of these charts creates an actionable insight for DevOps teams in the improvement of workflows that are continuous in nature, either in integration or development. Let's see how those charts would help a DevOps engineer:
Throughput
The number of executions in your pipelines over time, color-coded by their outcome, like success, failure, and action required.
- Understand Pipeline Activity: It would provide insight into patterns of pipeline executions, spikes in activity at specific times-that is, following major code merges or feature releases.
- Optimize Resources: Ensures adequate CI/CD infrastructure, like runner capacity, during peak activity.
- Monitor Productivity: If the throughput happens to be lower, with fewer commits, it may relate to missed triggers or bottlenecks in a development process.
Example Use: If throughput suddenly drops, check if it’s due to fewer commits, misconfigured triggers, or CI bottlenecks. Fixing these ensures your CI runs smoothly and consistently.
Failure Rate
Presents the percent of pipeline executions that failed over time.
- Track Reliability: Points to pipelines or periods of time when failures are spiking.
- Stability Focus: Identify which flaky tests or unstable workflows are causing the repeated failures.
- Improve Developer's Trust: Reducing the number of failures means developers can trust this pipeline and will be all over it.
Example Use: If any day or pipeline is out of the ordinary in terms of failure, you would review the changes that were introduced that day or investigate recurring errors in that pipeline.
Average Duration
Monitors how long, on average, each pipeline execution takes to complete.
- Delayed Spots: Pinpoints pipelines that demonstrate upward-trending durations that may affect delayed feedback loops, and in consequence, slower development cycles.
- Improve Workflow Speed: Helps diagnose inefficiencies, such as slow builds, resource bottlenecks, or excessively long tests.
- Performance Goal Setting: Ensures pipelines fall within acceptable duration thresholds to keep the CI/CD feedback fast.
Example Use: If the average duration is steadily increasing, it might suggest that either caching is not enabled or the complexity of the test suites is growing; the former can be enabled, and the latter can be addressed in order to lower the execution time of pipelines.
MTTR - Mean Time to Recovery
Measures the time it takes to recover from a pipeline failure and return to successful runs.
- Measure Responsiveness: It monitors responsiveness regarding how quickly your team detects and resolves a failure.
- Improved Team Productivity: Reduction in MTTR means minimum downtime and faster delivery cycles.
- Highlight Problematic Pipelines: High MTTR may indicate the complexity of workflows or lack of appropriate error-handling mechanisms.
- Proactively Identify Bottlenecks: Use throughput and failure rate charts to identify which pipelines create bottlenecks in the continuous integration and continuous deployment process or repeatedly fail.
- Prioritize Fixes Based on Impact: Combine failure rate and MTTR data to understand which pipes will be most disruptive, and therefore should be fixed first.
- Improve Feedback Loops: Analyze trends in average duration to ensure developers get fast and reliable feedback on their code changes.
- Resource Allocation Plan: Throughput data and average duration will enable planning the CI/CD runner capacity to avoid delays if peak activities are going on.
- Tracking Optimizations Over Time: Use these metrics to understand if improvements (like caching, test parallelization) are having the desired effect.
Job Summary
The Job Summary section deeply analyzes the job-level metrics, which enable the DevOps teams to drill down into the specific tasks of pipelines. It highlights failed jobs, their execution times, and duration trends.
Failed Jobs Chart
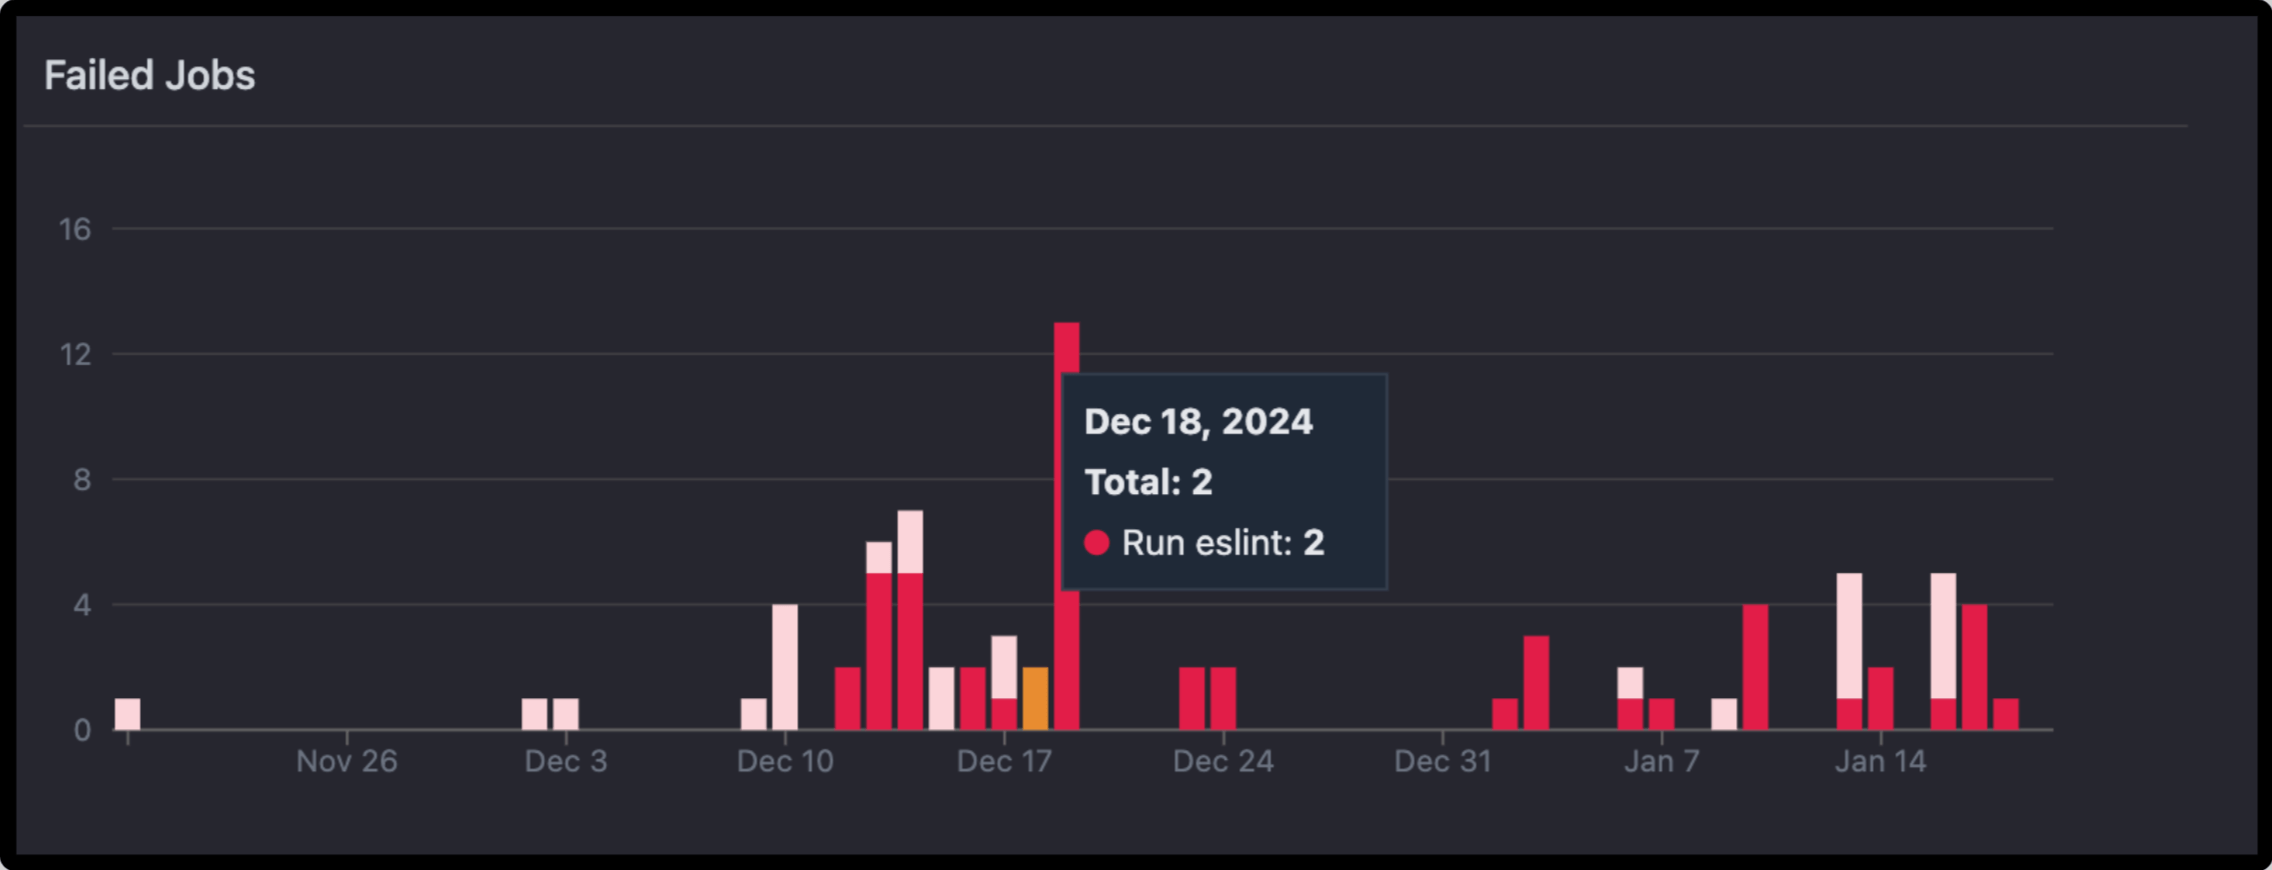
This bar chart shows the number of failed jobs each day over a given time period. Hovering over a bar will show detail such as:
- Total number of failed jobs in that day.
- Breakdown by job name and count.
- Find out the Trends: Identify spikes or consistent patterns in job failures over time.
- Pinpoint Problematic Days: Quickly understand on which days the failure rate was higher and investigate related changes.
- Focus Debugging Efforts: Zero in on jobs with the highest failure counts to prioritize fixes.
Example Use: If there's a spike in job failures on a specific date, look at the changes that were introduced on that day-say, new commits or configuration changes-to find what happened.
Relative Change in Median Job Duration
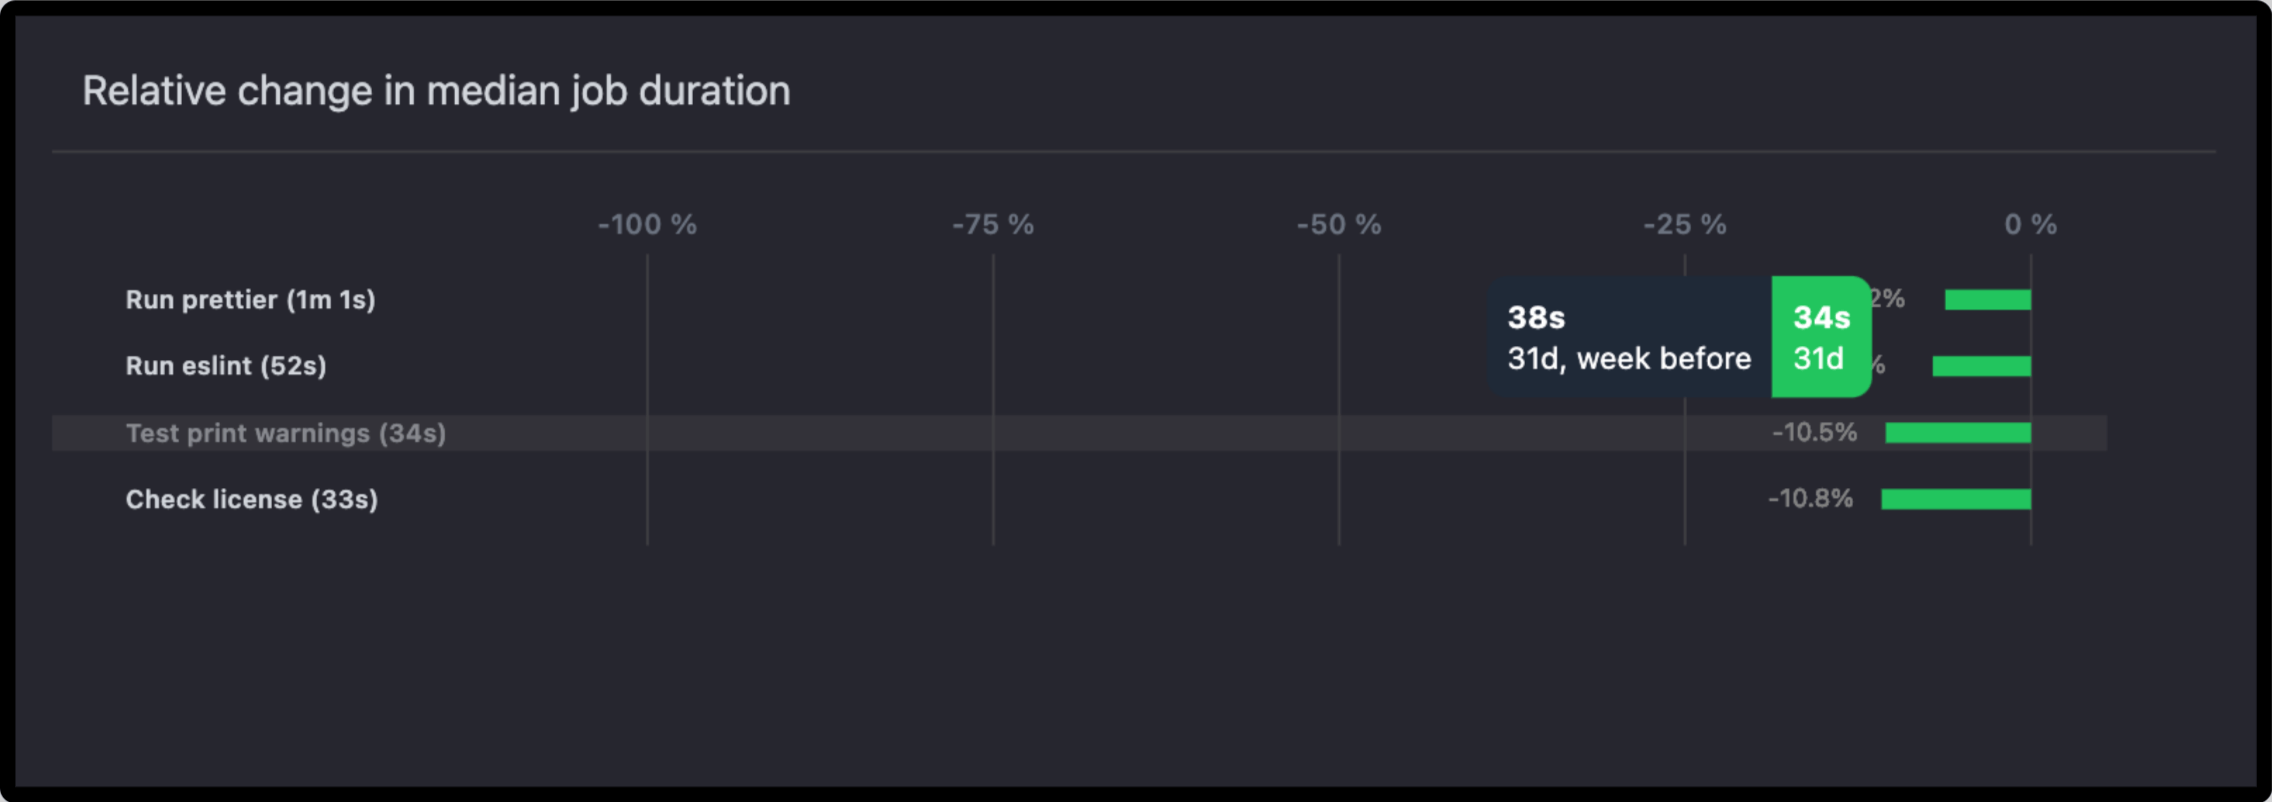
This bar chart, plotted horizontally, represents the percent changes in median job duration (P50) of the respective jobs.
- Positive changes reflect the lengthening of job duration, hence bottlenecks.
- Negative changes, depicted by green bars, reflect an improvement in job duration.
- Track Optimization Efforts: Understand which jobs are running quicker after enhancements.
- Spot Potential Bottlenecks: Identify jobs with increasing durations to investigate inefficiencies.
Example Use: If a job has taken 20% longer than before, analyze its configuration or dependencies for further optimization.
Key Job Table Metrics
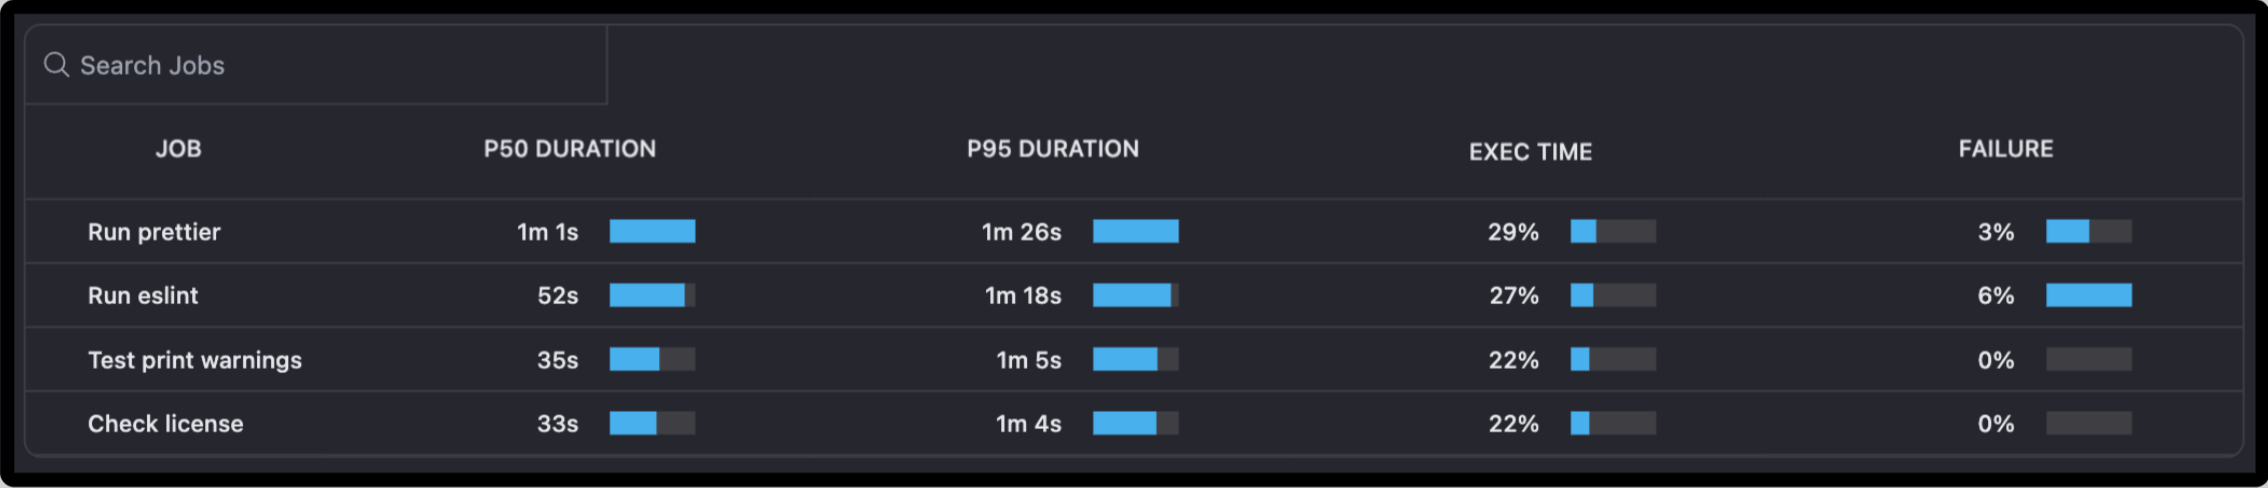
The table below is a detailed insight into the performance of each job, including:
- P50 Duration (Median Duration): The median value of the job execution durations gives the general feel of the job performance.
- P95 Duration: This shows the longest-running 5% of executions to address outliers.
- Execution Time (%): Percentage of time this job takes compared to the pipeline.
- Failure Rate: The percentage of runs that failed for each job.
- Measure Job Stability: Highlight jobs with high failure rates and study the root causes of failures.
- High-Impact Jobs: The jobs with the highest execution time or P95 duration point to areas of optimization.
- Optimize Resource Usage: Ensure that frequently executed jobs don’t consume unnecessary resources due to inefficiencies.
Example Use: A job failing a lot or having a long P95 duration may indicate flakiness or inefficiency. These should be top of the list in terms of fixing to improve pipeline reliability and overall execution time.
- Prioritize the debugging of jobs with very high failure rates or jobs whose execution time has spiked.
- Minimize Resource Utilization: Optimize for jobs that run for a long time to cut down on resource usage and quicken the speed of pipelines.
- Tracking Improvements: Observe the changes brought about by optimization on job duration using the relative change chart.
- Proactive Issue Resolution: Job failure patterns are identified in advance to catch issues before they hit the entire pipeline.
Pipeline Executions: Monitoring the Trend of Executions
Overview The Pipeline Executions section provides a view of the execution activity that has occurred on a given pipeline. It includes a small timeline showing execution trends over time, as well as a detail table summarizing each of the runs in that time period. This page is useful during the day-to-day activities to monitor the pipeline health, spot bottlenecks, and understand run status.
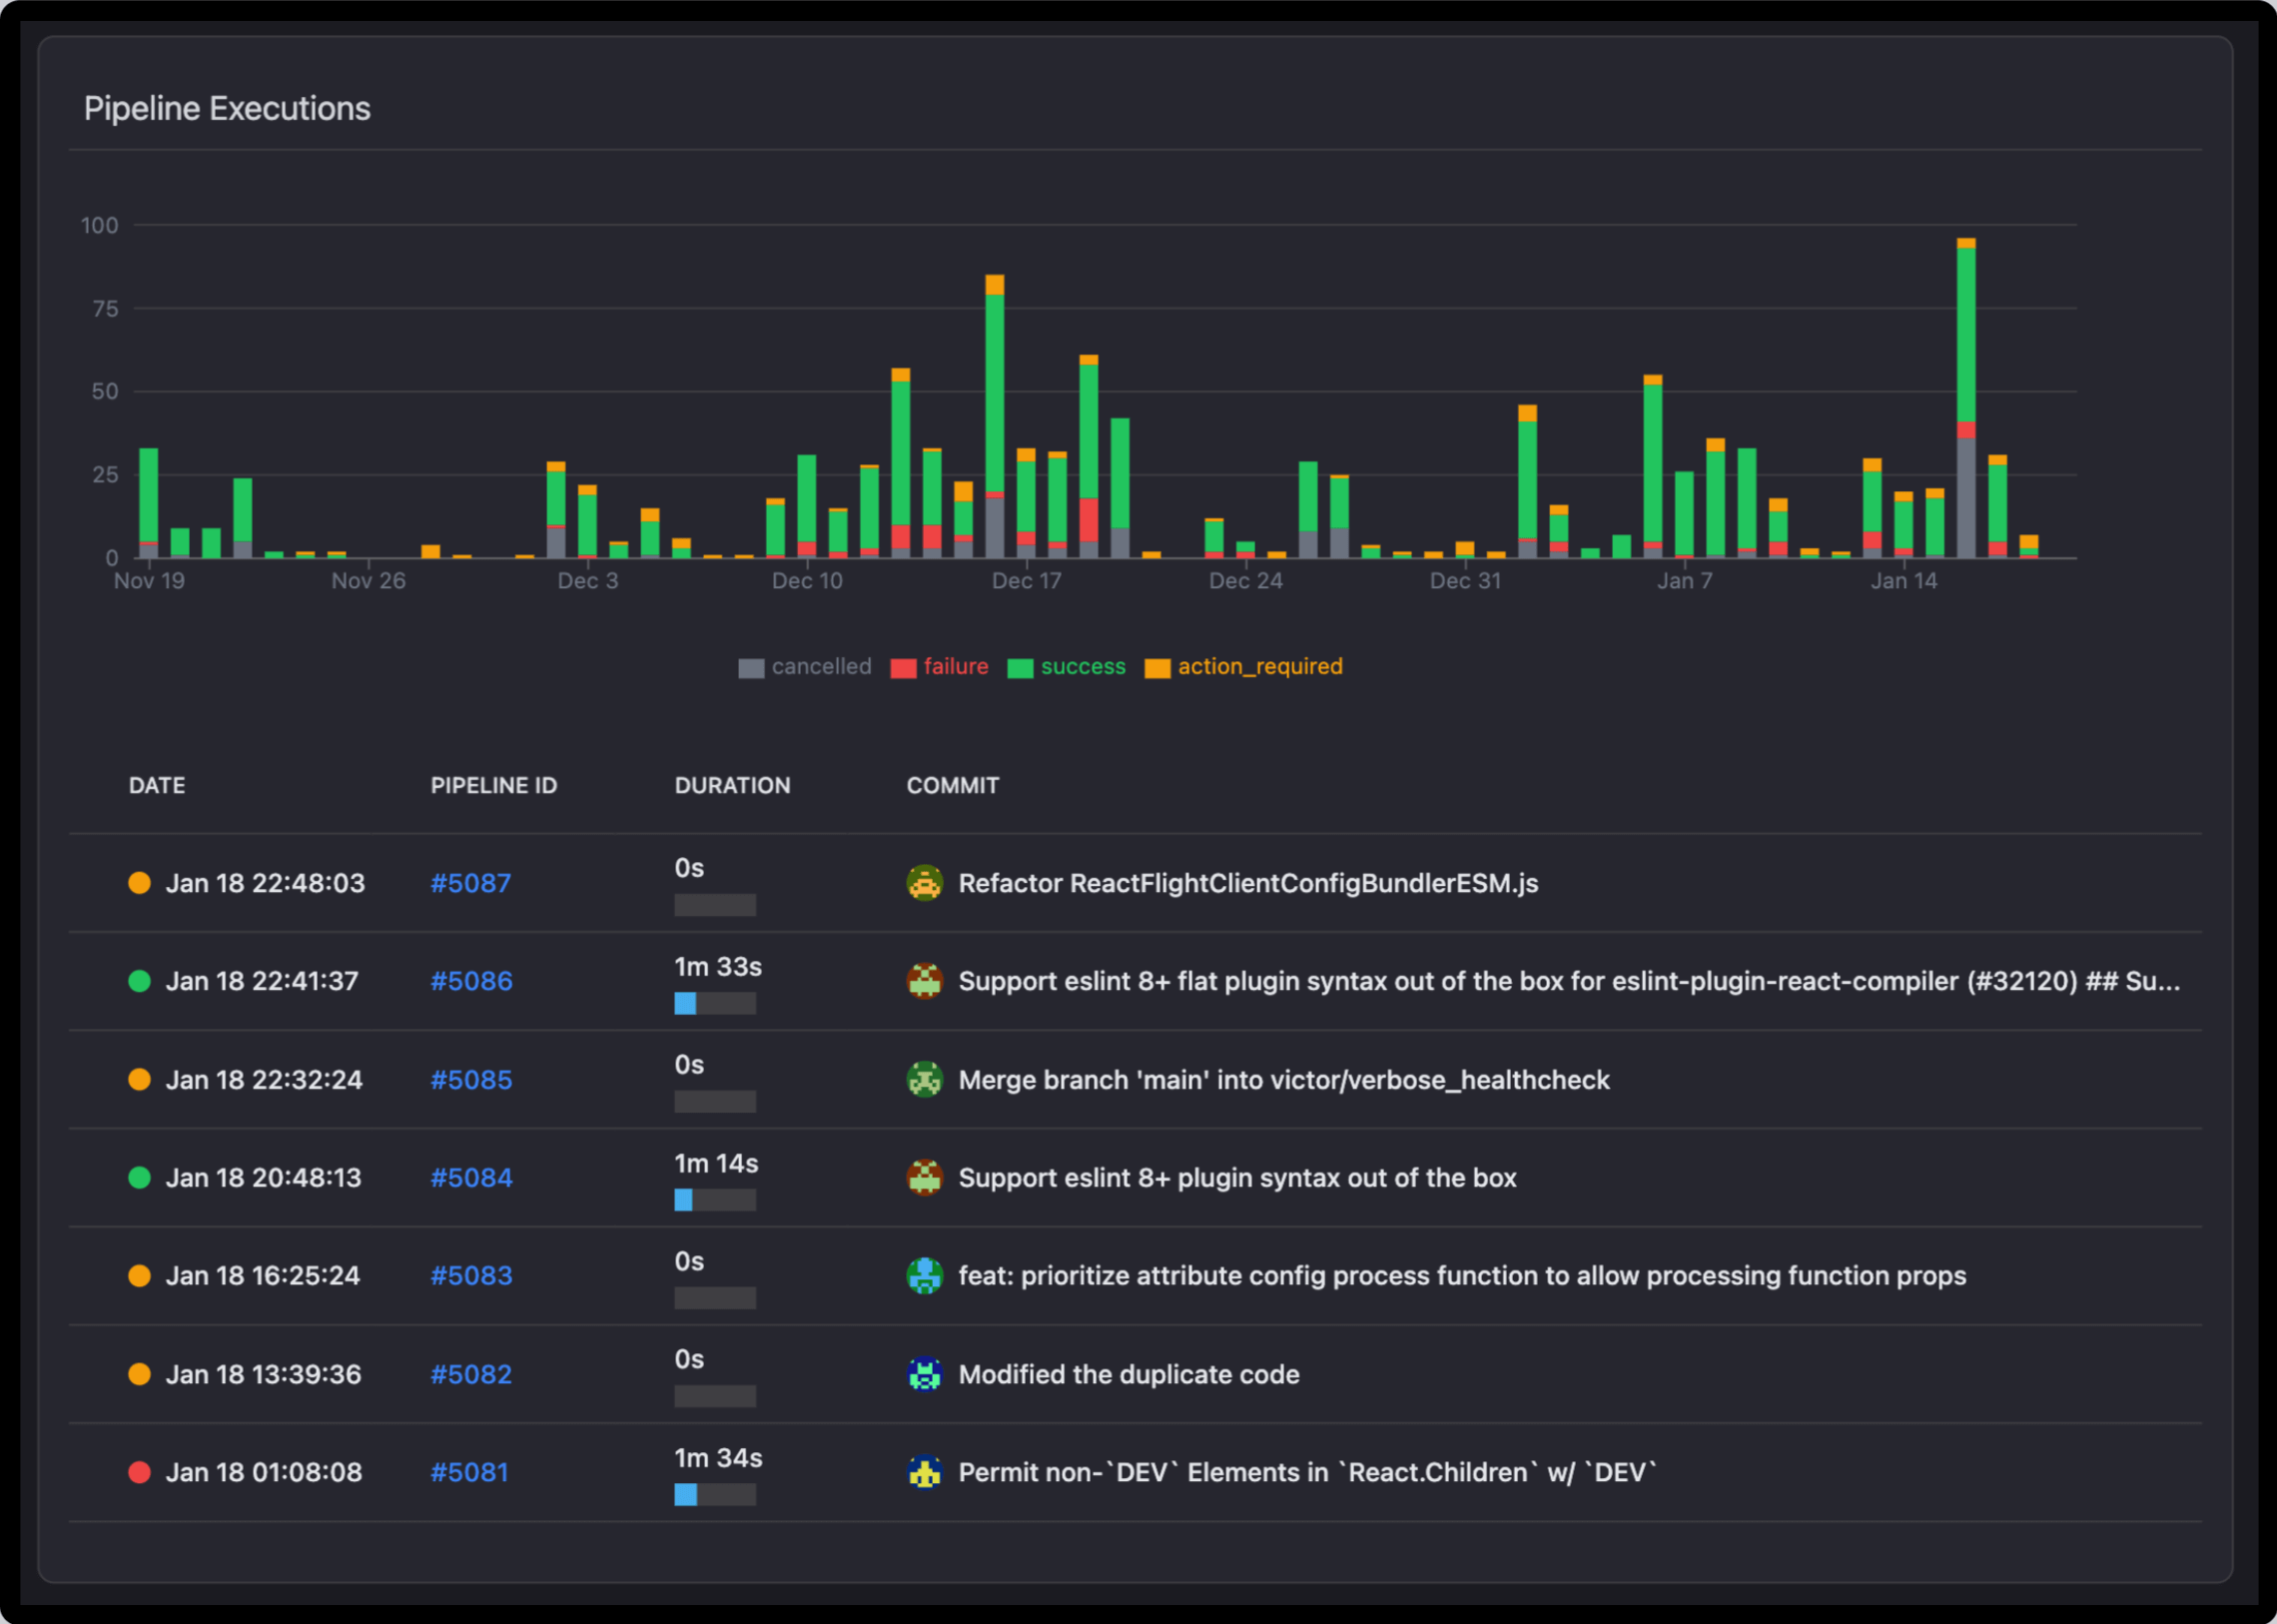
Execution Trends Chart
The chart below plots the number of pipeline executions over time, grouped by their status:
- Success-Green: Runs completed with no issues.
- Failure (Red): Runs that had some kind of error.
- Actions Required-Yellow: These are runs requiring manual intervention.
- Cancelled Gray: The runs that were stopped before completion.
- Pattern Spots: Visualize how execution frequency and results change over time.
- Anomaly Detection: Identify sudden spikes in failed or cancelled executions.
- Monitor Workflow Activity: Realize when the pipelines are being triggered most frequently and their outcomes.
Example Use: A spike in failed executions on a particular day may indicate an issue introduced in a recent commit or a resource limitation.
Pipeline Runs Table
The table provides the following information about each execution of the pipeline. It includes:
- DATE and TIME: Date and Time the pipeline was run.
- Pipeline ID: Unique identifier for the run, clickable for detailed logs.
- Duration: How long the execution took to complete.
- COMMIT: The associated code changes or commits that trigger the run.
- Find Runs: Trace certain runs - find a pipeline execution by date or commit.
- Analyze Impactful Changes: Investigate the effect of specific commits on pipeline success or failure.
- Monitor Duration Trends: Spot unusually long durations to address inefficiencies.
- Debug failures: Use the table to drill into failed runs and cross-check associated commits for any potential issues.
- Pipeline Performance Optimization: Analyze the table for the duration of running tests and builds to identify and remove inefficiencies.
- Monitoring of Developer Activity: Taken together, the chart and table of run frequency give insight into development activity and productivity for a team.
- Proactive tracking and resolving of issues: Quickly identify and address failed or action-required runs that are recurring in order to maintain smooth workflows. This section provides the necessary combination of aggregated and granular data that enables DevOps teams to maintain pipeline health, optimize performance, and ensure consistent delivery.